
 Dacity Coin
 NEAR Protocol
 Pearl
Pearl Pudgy Penguins
 Injective
 Aerodrome Finance
 Pump.fun
- Diamondback Energy Inc.’s stock price is currently above the 50 and 100-day EMA levels.
- FANG’s stock price is currently trading at $145.64.
- Diamondback Energy Inc.’s (NASDAQ: FANG) live market cap is $31.97 Billion.
Diamondback Energy Inc.’s (NASDAQ: FANG) stock price is now on the rise. The price of the FANG stock is rising to higher highs on a weekly basis.
Diamondback Energy Inc. (FANG) stock has a market cap of $31.97 Billion with a revenue of $8.62 Billion. The 52-week high of the stock is 145.67 and the 52-week low is $142.72. The P/E ratio of FANG is 5.87 and EPS is 24. This indicates that the company’s earnings are increasing.
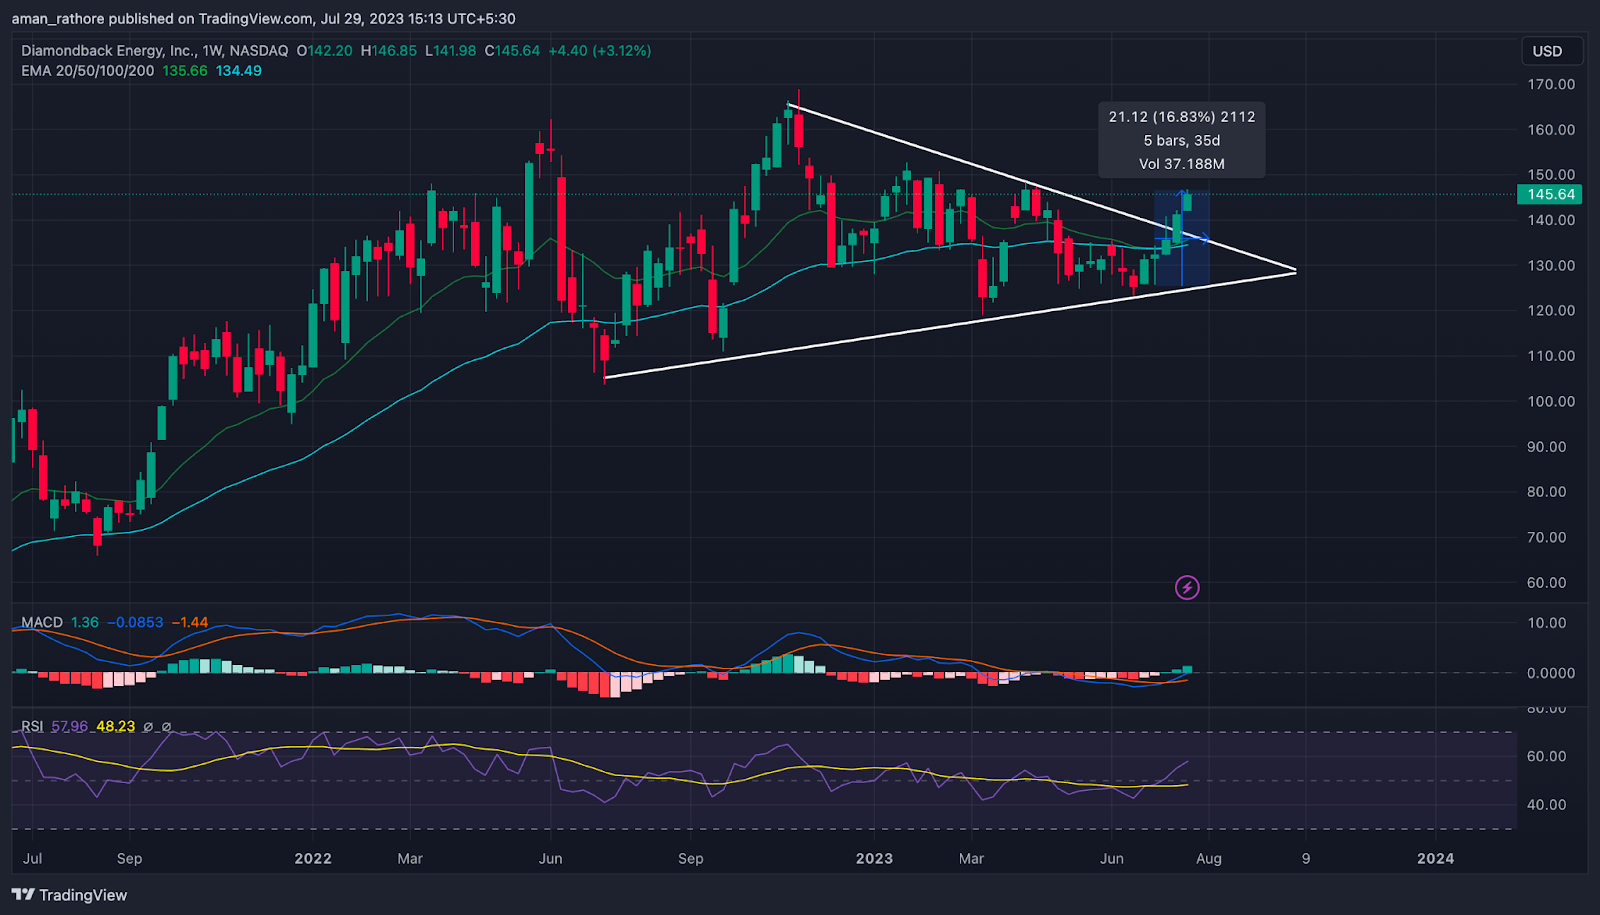
In November 2022, the stock price of Diamondback (FANG) made a high of $168.95 and afterwards, the price of the stock started declining. The stock price of FANG has given a downfall of around 30% in three months.
However, the price found support at the $118 level and the price rebounded. The price movement of FANG has formed a symmetrical triangle pattern. Based upon the current market scenario, the price of FANG has given a breakout from the triangle pattern with very good momentum.
The price has given a rise of around 16% in a month and the overall structure of the stock price seems to be positive. This indicates that the price is likely to rise in the upcoming days.
Diamondback Energy Inc. (FANG) Stock Price Analysis
EMA
The price of Diamondback Energy Inc.’s stock is currently higher above both its 50-day and 100-day exponential moving averages. Given that the stock is currently in a strong trend, the price may increase in the upcoming days.
MACD
The MACD line for the FANG stock is currently placed above the signal line and also the formation of green histogram is easily identifiable. This indicates that the price of the stock is forming a positive pattern.
RSI
Both the 14-day Simple Moving Average (SMA) line and the Relative Strength Index (RSI) line for the FANG stock is quite close to 70. The rising RSI line, therefore, indicates that prices will increase.
Conclusion
Diamondback Energy Inc.’s stock price is increasing, and analysis of chart indicates this trend will probably continue in the future. As the signs point upward, the price is reaching higher highs. It is therefore expected that the price of FANG stock would rise during the next few days.
Technical Levels
- Support Level– $123.
- Resistance Level– $164.
Disclaimer
The views and opinions of the author, or anyone named in this article, are for informational purposes only. They do not offer financial, investment, or other advice. Investing or trading crypto assets involves the risk of financial loss.




