
 Minter
 Bittensor
 Hyperliquid
 NEAR Protocol
 Monero
 Pearl
Pearl Quantus
- WIZZ stock price currently trading at $2400.
- The Stock is in a downtrend in the short term.
Wizz Air, established in June 2003 by József Váradi, is an airline company offering global passenger air transportation services. Additionally, Wizz Air extends its offerings to include services such as car rentals, hotels, and airport parking. The company, under the leadership of CEO József Váradi, employs over 7,350 individuals.
In a recent development in August 2023, Wizz Air inked a definitive agreement with Airbus for the procurement of 75 Airbus A321neo aircraft, expanding its existing order to a total of 434 units of the largest single-aisle aircraft model, along with 565 units of the A320 aircraft model. This strategic move positions Wizz Air for continued growth and expansion in the aviation industry.
Is WIZZ Price Reflecting a Bearish Sentiment?
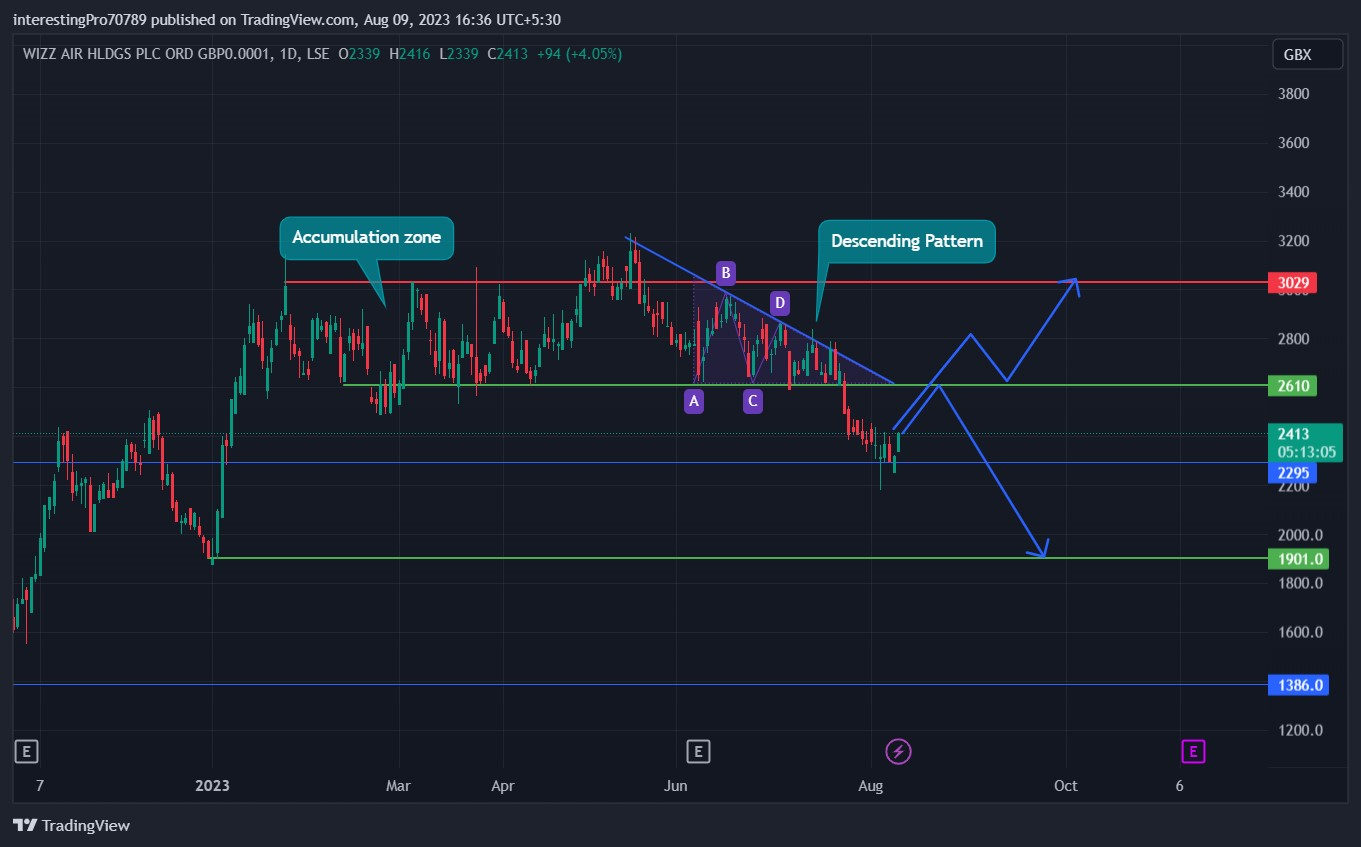
In January 2023, Wizz Air established a robust support level at $1901, sparking a substantial bullish rally with strong buying activity from that point. This solidified the $1901 support as a significant level. Following this bullish surge, WIZZ Stock price encountered resistance at $3029 and subsequently entered an accumulation phase that spanned around 7 months, ranging from $2610 to $3029. This accumulation signaled a positive outlook for further bullish continuation.
However, WIZZ Stock price later broke down from the support of the accumulation zone, forming a descending pattern which carries bearish implications. Presently, the price is finding support at $2295, potentially indicating a pullback or retest of this level. This is a common occurrence after a breakdown or breakout.
Technical Indicators prediction about the current trend
While the recent price movement suggests a bearish sentiment, the long-term perspective of the Wizz chart remains bullish due to the strong buyer presence at the $1901 support level. If the price manages to reclaim the $2610 level and subsequently breaks out, it could indicate a renewed bullish momentum targeting the $3029 resistance. Conversely, if WIZZ Stock price faces rejection at the $2610 level or its current trading level, a decline towards the $1901 support may be observed.
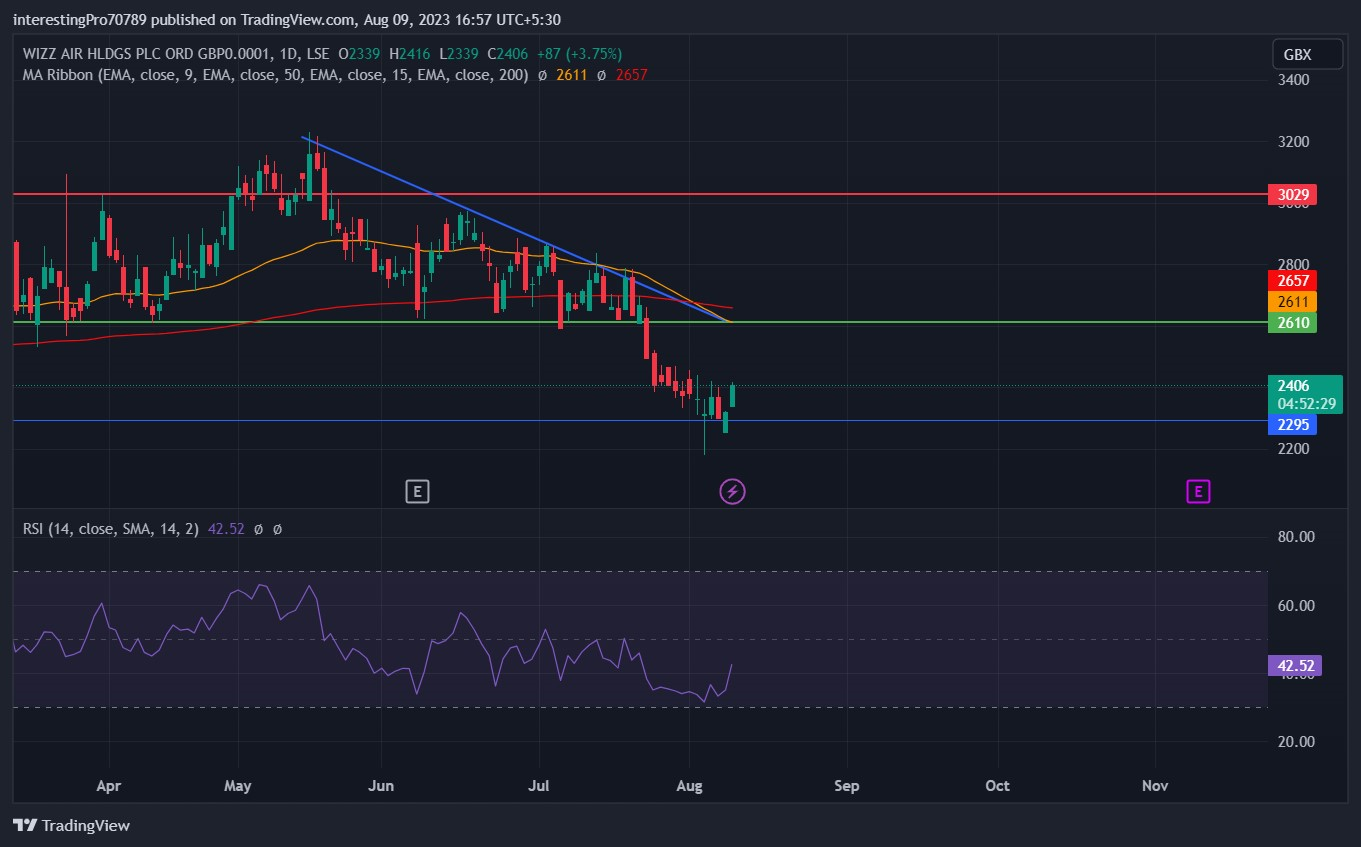
The 50 EMA (yellow line) is situated at $2611, while the 200 EMA (red line) is positioned at $2657. A “golden crossover” has occurred, indicating a bearish sentiment as the 50 EMA has crossed below the 200 EMA. The fact that WIZZ Stock price is trading below both the 50 and 200 EMAs further reinforces the bearish outlook. Additionally, the considerable distance between the price and the EMAs suggests that there might be a potential upward movement towards these EMA levels, where they could act as resistance.
The relative strength index (RSI) is currently at 42.60, below the neutral level of 50. The RSI line is trending upwards, signifying that the price is in a state of recovery. This could indicate a potential pullback in the near term as the price adjusts. Overall, the combination of the EMA crossover and the RSI movement suggests a cautious sentiment in the market, with the possibility of a short-term rebound or pullback.
Conclusion
WIZZ’s recent chart depicts a breakdown from the $2610 accumulation zone, following robust buying at the $1901 support. This setback doesn’t alter the overall bullish view stemming from strong buying at $1901. If WIZZ Stock price rebounds to breach $2610, it could trigger renewed bullish momentum targeting $3029 resistance, potentially invalidating the breakdown. However, failure to hold above $2610 might result in a retest of $1901 support. This pivotal $2610 level dictates WIZZ’s trajectory, either extending its bullish trend from $1901 or testing lower support.
Technical levels
Resistance levels: $2610 and $3029.
Support levels: $1901.
Disclaimer
The views and opinions stated by the author, or any people named in this article, are for informational purposes only. They do not establish financial, investment, or other advice. Investing in or trading crypto assets comes with a risk of financial loss.




