
 Dacity Coin
 streamoors
 Pudgy Penguins
 Injective
 Celestia
 Sui
Sui Pearl
Pearl
- The stock price of Future PLC has experienced a downfall of more than 80%. See the reason
- The stock is seen breaking resistances continuously.
- The RSI is indicating a show rise in the bulls as they have kept fighting at its neutral level.
FUTR PLC’s revenue model is made upon the acquisition of special magazine titles cheaply. and the integration of them over a centraliz platform which helps them generate their revenue.
Future report in its latest update near February 2023. that it is experiencing a decline in audience numbers in its public websites like Marie Claire UK, GamesRadar, etc.
The update was confirm by the half-yearly report where the sales numbers were stagnant and declining over the Year on year. (YOY) mark, and as expect the market reacted the way it should’ve, and a fear of reckless selloff was seen bringing the price levels down to more than 80%.
Technical analysis of FUTR stock.
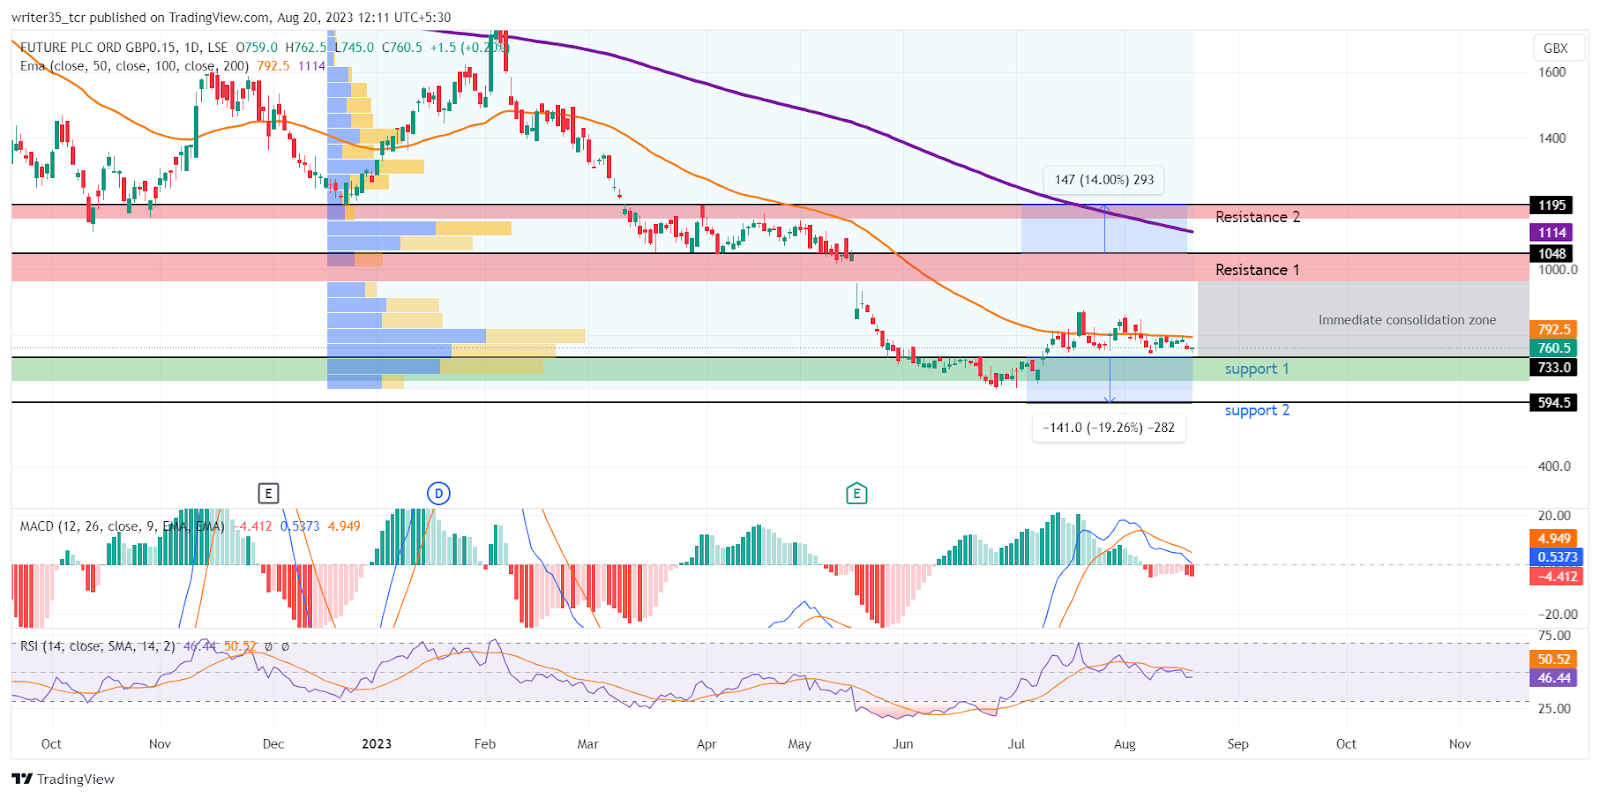
As of this writing, FUTR stock price is seen struggling to stay above its support levels as the bears are mighty in this fearsome trend. we have some strong resistance levels upside while the indicators have some interesting insight.
The price is trading on its immediate support which is at the level of £733 with good volume levels in sight. The second support is made upon the level of £594 since the price is at its lowest in 3 years, it is made upon the breaking of its resistance in 2019.
The first and immediate resistance is seen at the level of £1,048, this is where the price broke its support and came down. Furthermore, the second resistance is at the level of £1,195
The MACD chart is seen crossing up and over the neutral mark back in July. of this year and then coming back to a bearish trend as the Signal line made a crossover with the MACD Line at the start of August. The MACD and the signal line are on the levels of 0.53 and 4.94 respectively
On the other hand, RSI is showing an interesting tussle between bears and bulls as both have manage to keep it on a neutral territory of nearly 50 since the start of August this year. However, its SMA is above which is indicating a shallow weakness in the bulls.
Meanwhile, In the recent past the 50 EMA has been constantly above the FUTR stock price. rejecting a bullish trend, but currently it is at the level of £792 which is close to the current market price. this is indicating a slow rise in the strength of bulls recently. moreover the 200 EMA is sliding down above the levels of £1,114.
Conclusion
The FUTR stock price prediction will be based on the price behavior with its immediate support and its 50 EMA. as the share price is in the middle of both. If the bull pushes the price over its 50 EMA and sustains it. then an uptrend can be seen. otherwise, the price is likely to break its immediate support of £733.
Technical levels
Support: £733, £594
Resistance: £1,048, £1,195
Disclaimer
The views and opinions stated by the author, or any people named in this article, are for informational purposes only. They do not establish financial, investment, or other advice. Investing in or trading crypto assets comes with a risk of financial loss.



