
 Quack AI
 NEAR Protocol
 Pudgy Penguins
 Pearl
Pearl Quant
Quant Quantus
 Sui
Sui
- HSBC stock price shows selling pressure and is sliding towards a demand zone of $36.
- Sellers have gained momentum and looked aggressive after a bearish price action formation.
HSBC’s stock price shows bearishness in the short-term trend. The stock experienced a free fall after the disclosure of the quarterly results on the 1st of August 2023. The results triggered a gap down, as the stock showed a sharp breakdown. Afterward, buyers did not hold the momentum and started unwinding their positions resulting in slippages in the previous trading sessions.
However, the results topped wall street’s expectations with the revenues beating the analyst’s estimates by 7% and the earnings nearly 9% above the expectations of the Analysts.
The Investors took the results as the opportunity to book their profits and the stock slid down sharply triggering a free fall and wiping out 20% in less than 3 weeks.
HSBC Holdings (NYSE: HSBC) HSBC Holdings plc is a global bank and financial services company. It has offices in many regions, such as Europe, Asia, the Middle East and North Africa, and North and Latin America. Wealth and Personal Banking (WPB) group of HSBC offers banking and wealth management services to individuals and families.
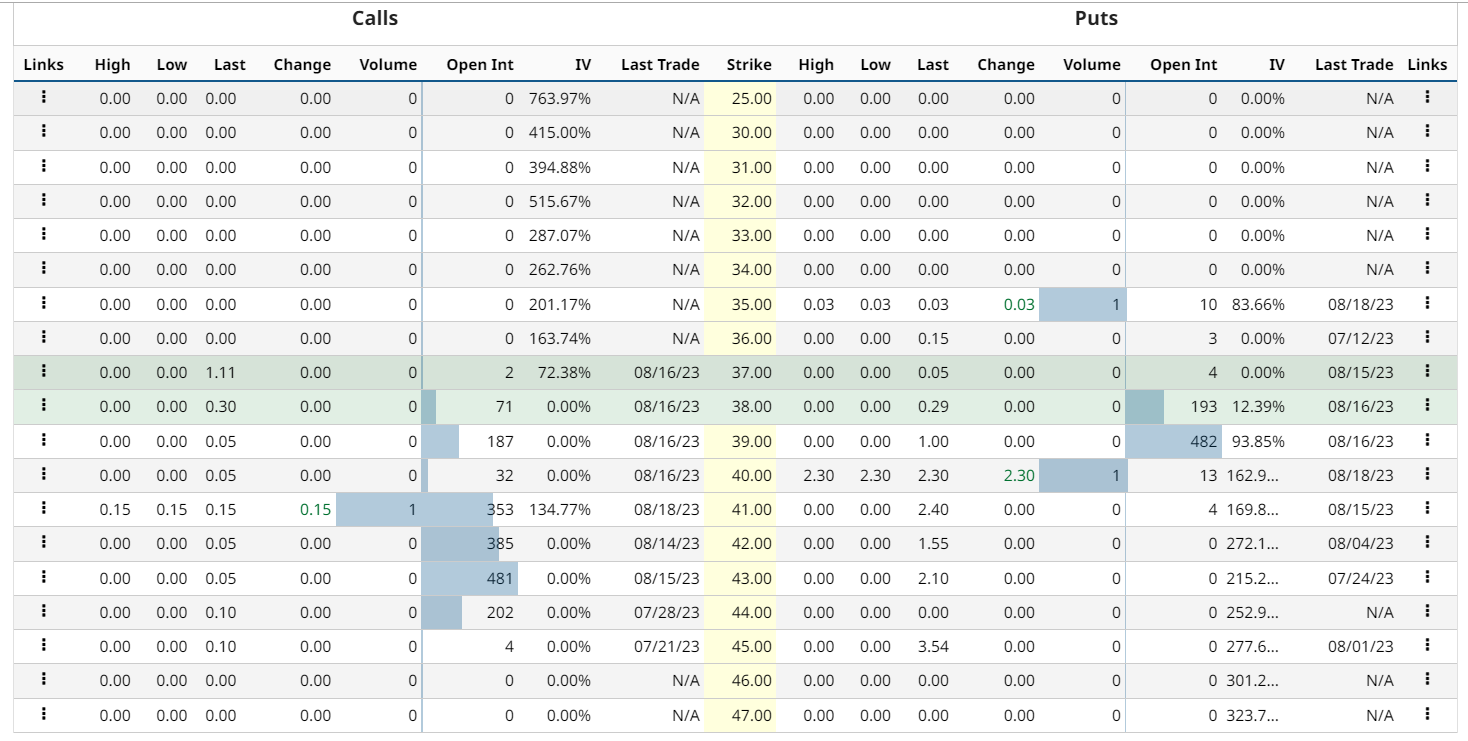
HSBC stock option-chain analysis states that the current implied volatility in the market is 21.98% with an increment of 0.73% in the last trading session. The at-the-money strike price has 193 open contracts on the put side and 71 open contracts on the call side indicating the dominance of buyers at the current level. The PUT/CALL ratio is 2.02 indicating that the price may decline may slow down.
HSBC Stock Price Seeking Buyers Volume On the Daily Chart
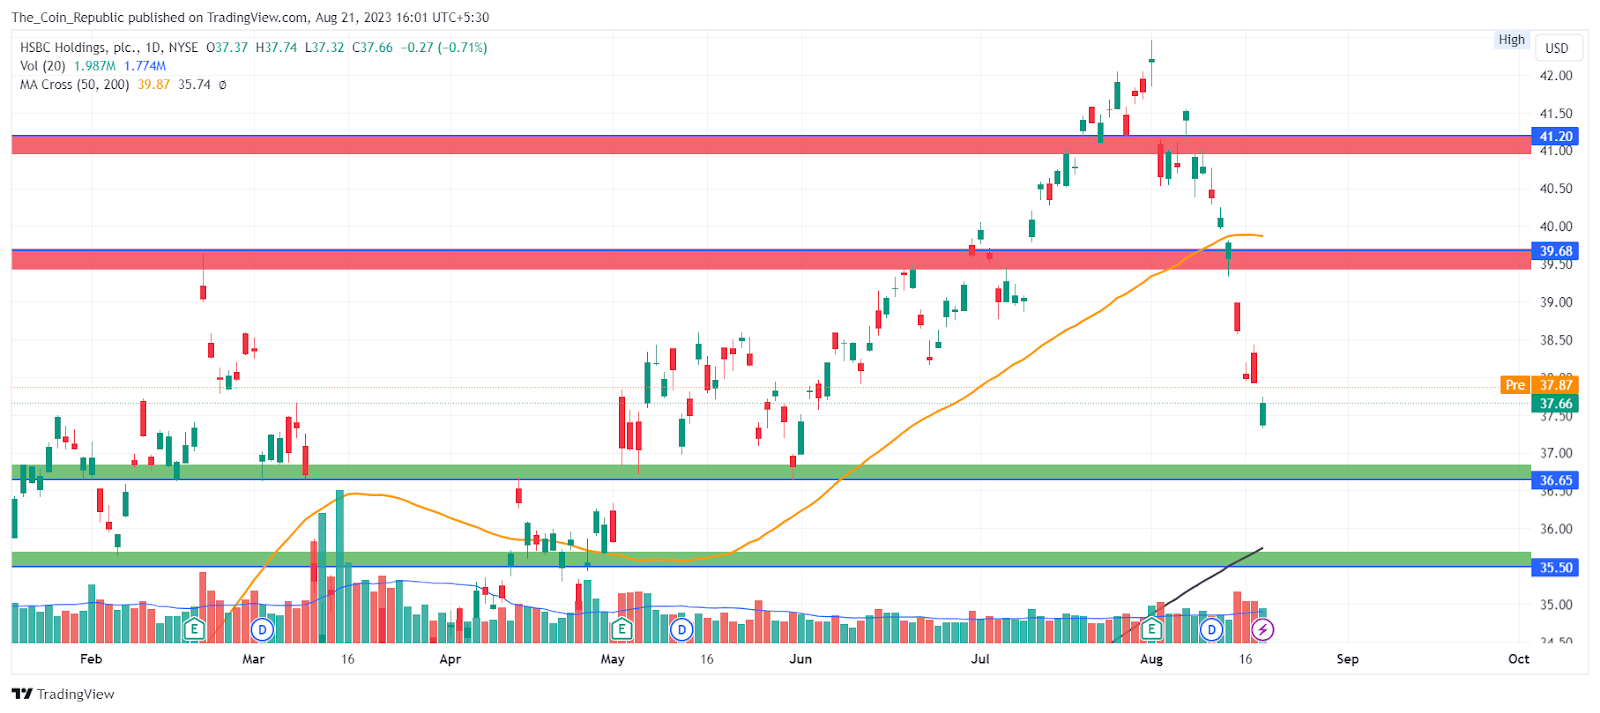
At press time, HSBC stock price is trading at $37.66 with an intraday drop of 0.71% showing selling pressure on the daily chart.
The stock is in a free fall and nearing a round level of $35 which may act as a halt to the declining price. The short-term outlook for the stock is neutral to bearish as the price may get the buyer’s volume for the recent support zones. The failure of which may turn the short-term objective of the stock bearish.
The long-term trend still stands on the bullish side as the price is trading above 200 EMA which may act as major support for the price and the trend may resume after taking a pullback.
The HSBC Stock Failed to gain Buyers’ support at 50 EMA
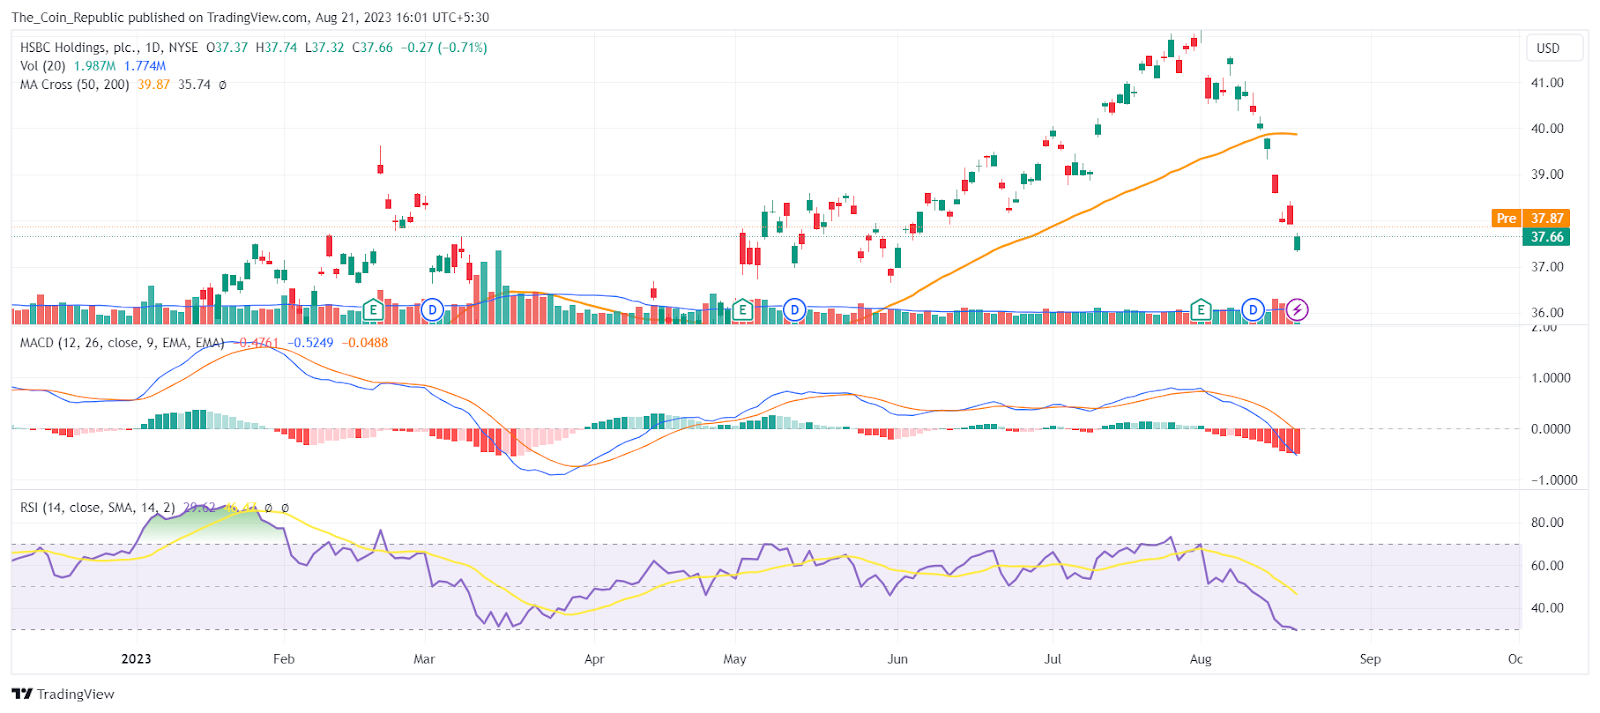
The daily HSBC stock price chart shows that the price is trading above 200 EMA indicating a strength in the long term. However, the stock failed to sustain above the 50 EMA indicating the dominance of sellers in the short term.
The overall Technical Opinion rating including RSI and MACD is signaling a 40% buy with the weakest short-term outlook on maintaining the current direction.
Conclusion
HSBC stock price prediction concludes stock price fell sharply after the quarterly results on August 1, 2023. Despite beating the analysts’ expectations. The results caused a gap down and a 20% drop in three weeks. The stock trades at $37.66, down 0.71% intraday, and nears a $35 support level. The short-term outlook is neutral to bearish as the price may find buyers at the support zones. The long-term trend is bullish as the price is above 200 EMA and may resume after a pullback.
Technical Levels
- Support levels: $36.65 and $35.50.
- Resistance levels: $39.68 and $41.20.
Disclaimer
The views and opinions stated by the author, or any people named in this article, are for informational purposes only. And do not establish financial, investment, or other advice. Investing in or trading crypto or stock comes with a risk of financial loss.




