
 Puffer
 ZKsync
 Bitcoin
 NEAR Protocol
 Pearl
Pearl Quantus
 Sui
Sui
- Tremor stock price is currently trading at 172.2 GBX.
- The company chart is reflecting a bearish sentiment.
Tremor International LTD. (LSE: TRMR) was founded on March 20, 2007. The company operates as a digital marketing and advertising consultant. It provides an end-to-end software platform that advertises target audiences to maximize yield on their digital advertising inventory.
Tremor International LTD. (TRMR) Stock: Financial Analysis
The Tremor company has done well in its revenue report from 2020 to 2022 with an overall growth of 0.65%.
The TRMR stock estimated revenue value for 2023 can be around 262.01 Million GBP. The company did not meet the estimated revenue value only in 2020 during the last three years. The company did not perform well in 2020 but after that showed stable growth in its revenue report.
Tremor International LTD. company has 0 dividend payout ratio over the last three years.
Tremor International LTD. (TRMR) Stock: Technical Analysis
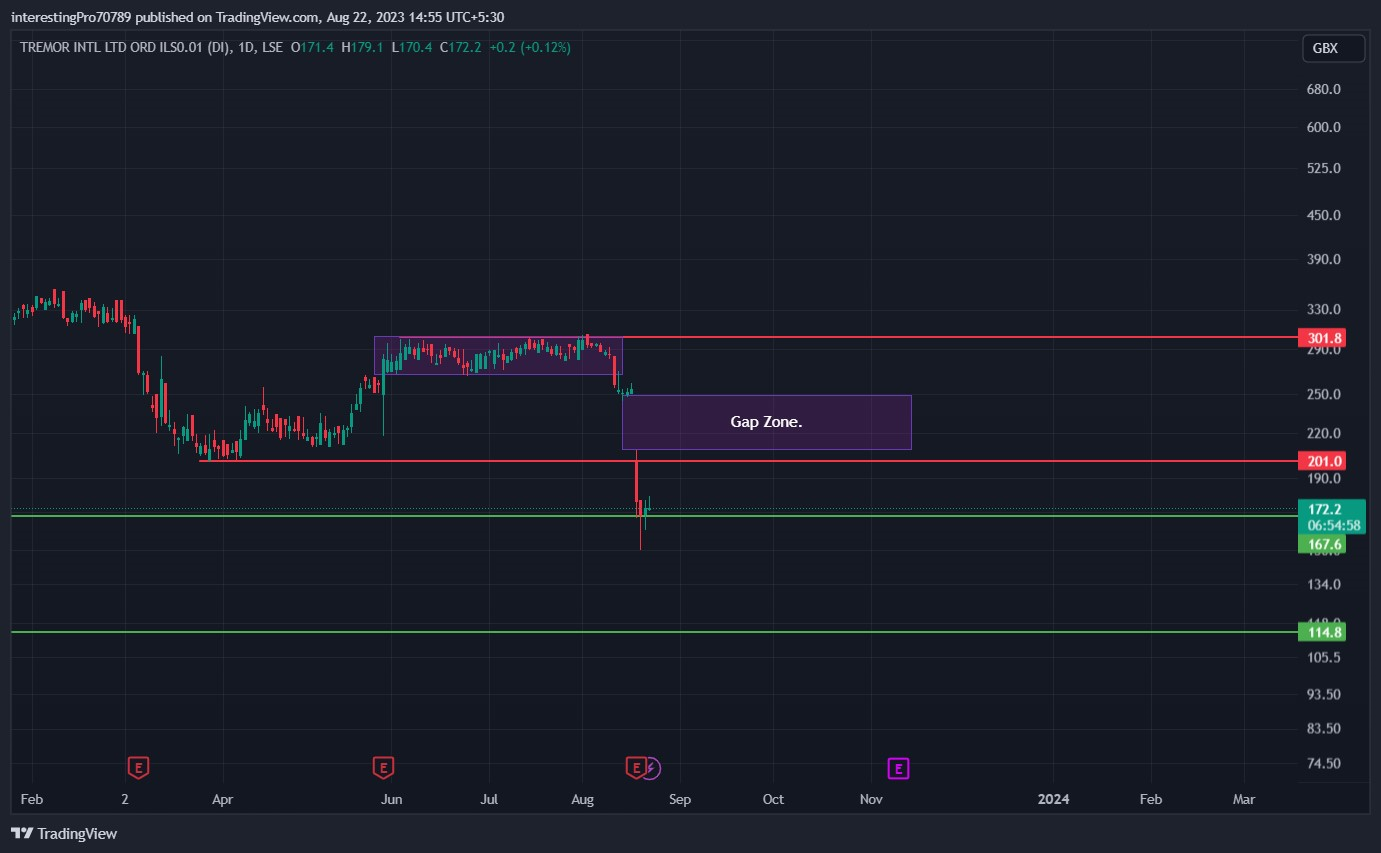
Currently, Tremor International LTD. stock is trading at 172.2 GBX with an average volume of 100.621K and a market capitalization of 264.51 Million GBP.
The TRMR price formed support of 201 GBX and rallied to 301 GBX in April 2023. The price got stuck in a narrow zone of 301 GBX to 267 GBX after facing rejection from the 301 GBX.
In August 2023, the price gave the breakdown of that narrow zone and 267 GBX support level. It started falling after the breakdown
The TRMR price was doing a gap-down scenario on 17 August because of the negative impact of the Q2 2023 result. That triggered a 12.50% decline in price on the same day.
Currently, the price is trading above the 167.6 GBX support level. Suppose the price sustains above this support and gives the breakout of 201 GBX resistance, it can fill the gap that was left in the market.
The Tremor stock price may fall to its next support at 114.8 GBX if doesn’t sustain over the 167.6 GBX support level and gives the breakdown of this level.
Technical Indicators’ Prediction About the Current Trend
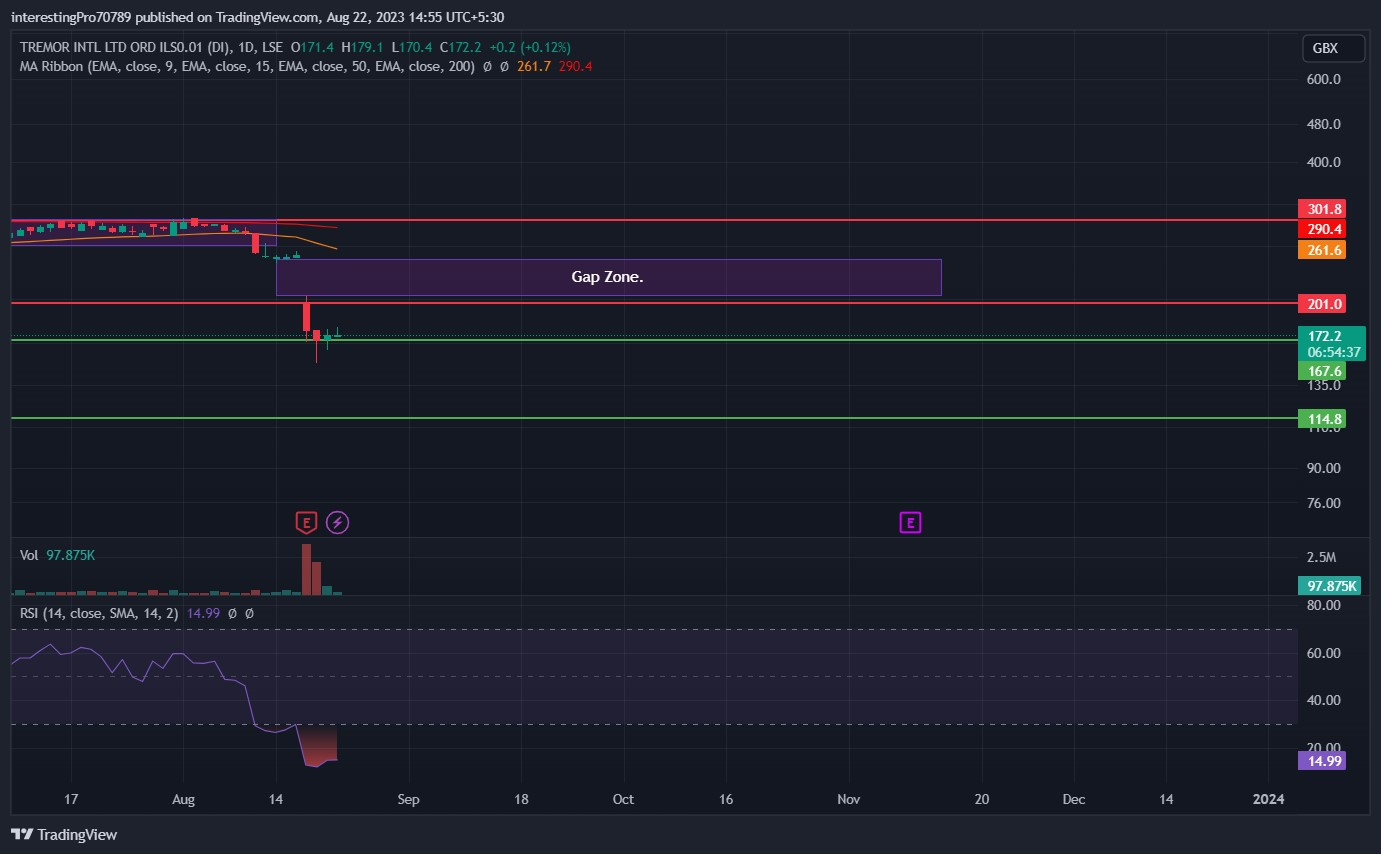
The 50 EMA (yellow line) is at 261.6 GBX and the 200 EMA (red line) is at 290 GBX. The price of TRMR is currently trading below the 50 and 200 EMA. However, the price is very far from both the EMA’s. That indicates the price is bearish in nature. A pullback can be seen shortly as the price is trading very far from both the EMA’s.
The relative strength index (RSI) line is at 14.99. The RSI indicates that the price is in oversold territory and a pullback can be seen shortly.
Conclusion
The overall chart of TRMR stock is bearish. But the price and indicators show that the price can be seen in bullish sentiment to fill the gap from current support.
Technical levels
Resistance levels: 201 GBX
Support levels: 167.6 GBX and 114.8 GBX.
Disclaimer
The views and opinions stated by the author, or any people named in this article, are for informational purposes only. They do not establish financial, investment, or other advice. Investing in or trading crypto assets comes with a risk of financial loss.



