
 Celestia
 Pearl
Pearl Quantus
 Zcash
Zcash Hyperliquid
 Aerodrome Finance
 NEAR Protocol
- The CCL stock price is trading at 1121 GBX.
- The stock price has given the breakdown of 1168 GBX support.
Carnival Plc (LSE: CCL) was founded on July 19, 2000. It is a multinational cruise and travel corporation. It sells vacation and holiday products to a consumer base with a wide range of cultural, linguistic, and leisure preferences.
Carnival Plc (CCL) Stock: Financial Analysis
Carnival Plc’s revenue report did not do well in 2020 and 2021. The revenue was lower than the revenue reported in 2019. In 2022, the company showed a 5.97% growth in the revenue report.
The company’s estimated growth in revenue for 2023 is expected to be 16.75 Billion GBP. The firm did not do well in the revenue report. However, it has always tried to close to the estimated revenue.
Carnival Plc (CCL) Stock: Technical Analysis
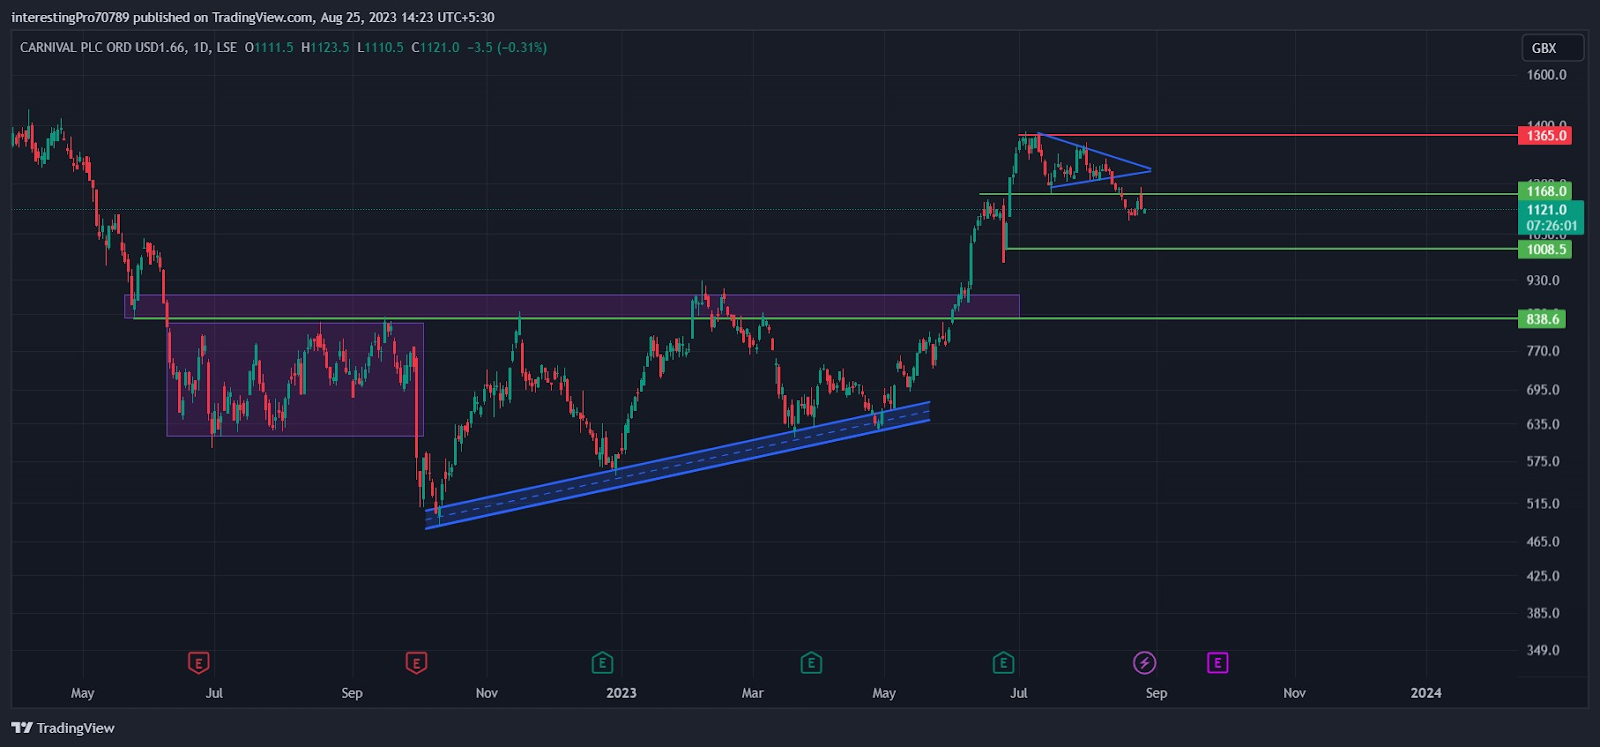
The Carnival stock price was in the consolidation phase for 4 months (around June to September) in 2022. The price gave the breakdown of the consolidation range and then started falling. The price faced immediate rejection and the breakdown was turned into a fakeout.
Further they formed support of a trendline and started a bullish rally in October 2022. It was facing rejection from 838.6 GBX every time it reached there.
The price closed above the 838.6 GBX resistance in February 2023, but it faced an immediate rejection. The breakout was turned into a fakeout and the price started falling. The stock value again fell and took support from the trendline.
The price finally gave the breakout of 838.6 GBX resistance in June 2023 and rallied to 1168 GBX. After a strong bullish rally, the price took a minor pullback and rallied again to 1365 GBX.
The price after commencing a bullish rally was seen in the range of 1365 GBX to 1168 GBX. The price also made a symmetrical triangle pattern at the top. Recently, the stock has given the breakdown of a symmetrical triangle and 1168 GBX.
The price is currently trading below the 1168 GBX after. A minor pullback brought it there, which can be seen as a retest. The price usually does such retests after a breakout or breakdown. If the price is sustained below 1168 GBX, it may go to the next support at 1008 GBX and then to 838.6 GBX.
However, if the price reclaimed the 1008 GBX support, it may again land at 1365 GBX resistance.
Technical Indicators’ Prediction About the Current Trend
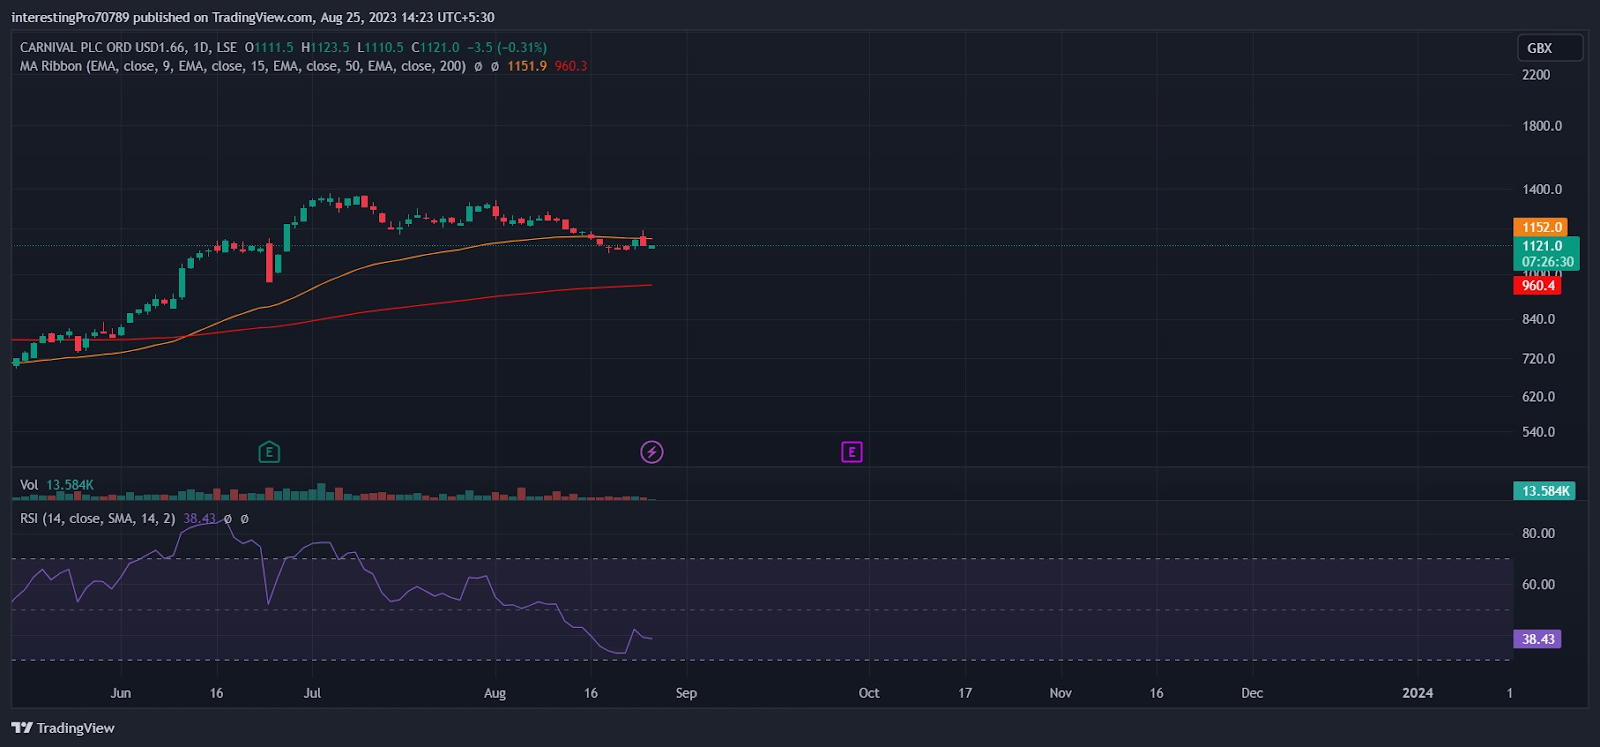
The 50-EMA (yellow line) is at 1152 GBX and the 200-EMA (red line) is at 960.4 GBX. The price of CCL is currently trading between 50 and 200 EMA. This indicates that the price is indecisive. It is currently taking pressure from buyers as well as sellers.
The relative strength index (RSI) is at 38.43. The RSI is in bearish territory. This indicates that the price of CCL is in bearish sentiment.
Conclusion
In Conclusion,The Carnival stock price is currently in bearish sentiment because it has given the breakdown of 1168 GBX. If the price forms a strong bearish candle, it may get the next support at 1008 GBX and 838.6 GBX. All the indicators mentioned in the CCL chart are bearish or neutral at the time of writing.
Technical levels
Resistance levels: 1168 GBX and 1365 GBX.
Support levels: 1008 GBX and 838.6 GBX.
Disclaimer
The views and opinions stated by the author, or any people named in this article, are for informational purposes only. They do not establish financial, investment, or other advice. Investing in or trading crypto assets comes with a risk of financial loss.




