
 Quantus
 Pearl
Pearl Quack AI
 Starknet
 NEAR Protocol
 Zcash
Zcash Aerodrome Finance
- The market capitalization of Opendoor Technologies Inc. (OPEN) for Intraday is $2.297B, which is the value of its outstanding shares. The enterprise value of OPEN for Intraday is $6.16B, which is the value of its business operations.
- OPEN closed with an advance of +4.97% trading at $3.38 in the last trading session.
Opendoor Technologies Inc. is a company that leverages technology to make the process of buying and selling homes easier. It has an online platform that connects home buyers and sellers and provides them with a better experience. It uses software, data science, product design and operations to build a marketplace for residential real estate that offers convenience, speed and certainty.
The largest shareholder of Opendoor Technologies Inc. (OPEN) is Vanguard Group Inc, which owns 9.35% of the shares. The insiders hold 0.59% of the shares and the institutions hold 44.32% of the shares.
Compared to Q2 2023, the revenue for OPEN stock has grown by +88.8% year-on-year and reached $1.23B. The gross margin has remained the same at 0.00%. The EBITDA for the same period is $847.00M.
Opendoor has an earnings per share of -$0.26 and a volatility of 0.76, which means it has 606,077,370 shares outstanding. The price-cash flow ratio for the OPEN share price is 8.59, which is a measure that investors use to evaluate the investment after considering the debt ratio of 0.88.
OPEN Stock Technical Analysis
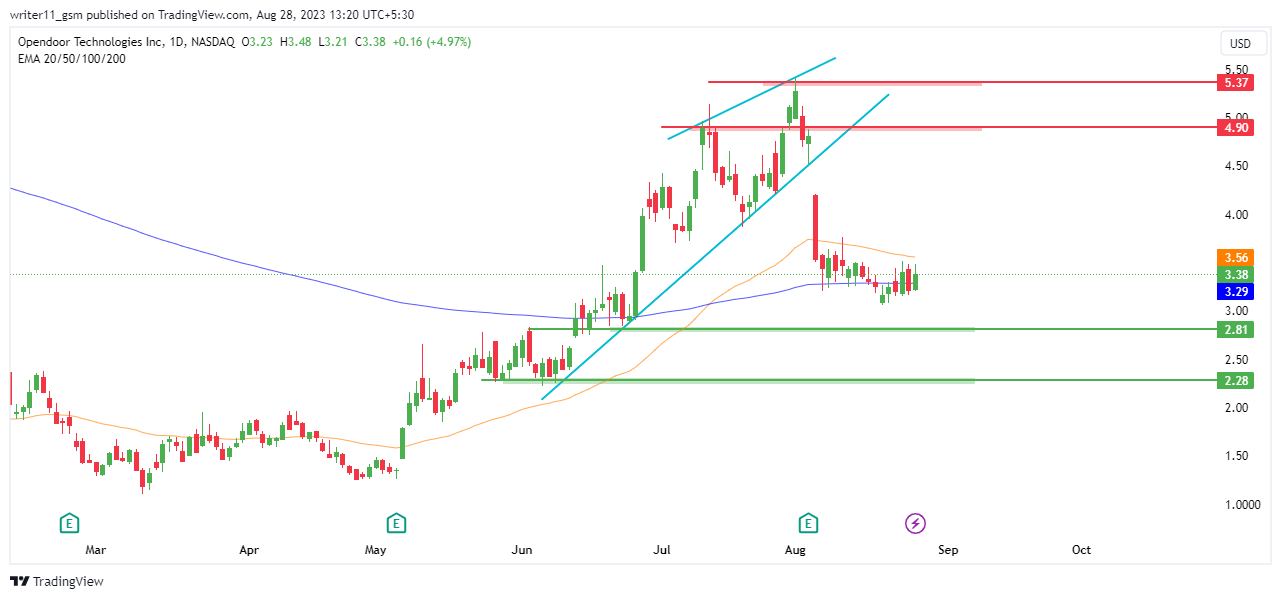
Opendoor Technologies Inc has been reaching new high points in the last few days, creating a rising wedge pattern. It recently fell below the pattern, which means a wedge breakdown. The price action is now bearish for the stock.
The OPEN share is trading within the channel of the 50-day and the 200-day EMA and it might drop further as it is forming strong bearish candles. If the market forms a death cross in the next few days, then we could see a strong downward momentum for the stock.
The OPEN Stock’s RSI is at 40.90, which means it has fallen below the 14-day SMA line and the 50 level. This shows that the stock is losing momentum and is likely to face more selling pressure. The RSI was previously too high, but it has reversed from there and is now bearish for the stock.
Open Technologies Inc Debt Analysis
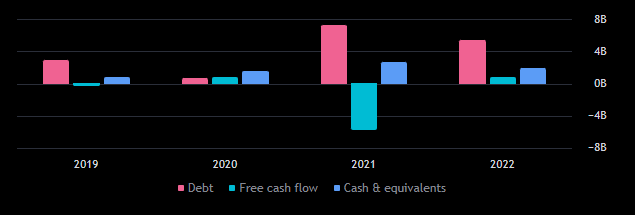
The company has reduced its debt by $1.71B and has $5.40B left in 2022. Its cash flow has also improved and reached $701.00M. This is what the tradingview debt chart shows.
Conclusion
The company’s free cash flow and financials are strong, but the charts show a bearish sign. The market has fallen below a rising wedge pattern, which could lead to more losses. The RSI is also negative, indicating a lack of momentum. However, the EMA’s are positive, suggesting that the buyers still have some hope in the market.
Technical Levels
- The support levels for the GSK stock are – $2.20 and $2.80.
- The resistance levels for the GSK stock are – $4.95 and $5.35.
Disclaimer
The views and opinions of the author, or anyone named in this article, are for informational purposes only. They do not offer financial, investment, or other advice. Investing or trading crypto assets involves the risk of financial loss.




