
 Dacity Coin
 Quantus
 Pudgy Penguins
 Pearl
Pearl Injective
 Starknet
 NEAR Protocol
- The previous closing price for USB stock was $35.51.
- U.S. Bancorp has a basic earnings per share of $3.60 and 1.533 Billion shares outstanding.
The dividends per share for U.S. Bancorp in 2022 were $1.88, giving a dividend yield of 4.31% for that year. The company distributed 50.92% of its earnings as dividends. The latest dividend, which was $0.48 per share, was paid on July 17, 2023.
The stock of U.S. Bancorp had a price-to-earnings (PE) ratio of 9.96 in 2022, which was 7.33% higher than the year before. A high PE ratio can mean that investors are ready to pay more for the stock, but it can also signal that the stock is overpriced.
The stock of U.S. Bancorp has fallen by more than -23.89% in a year. The company’s revenue rose from $21.78 billion in 2021 to $27.40 billion in 2022, but its net income plunged to $5.80 billion in 2022. This also affected the profit margin, which went down from 36.38% to 21.16% in 2022.
U.S. Bancorp Debt Analysis
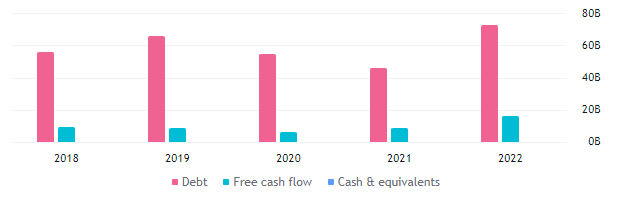
The debt for the company has increased by more than $26 Billion in a year from 2021 to 2022 and the free cash flow has advanced from $8.18 Billion to -$15.35 Billion. This indicates the poor performance of the company in the past year. The following price data points could be the reason for the decline in price in the last year.
USB Technical Analysis
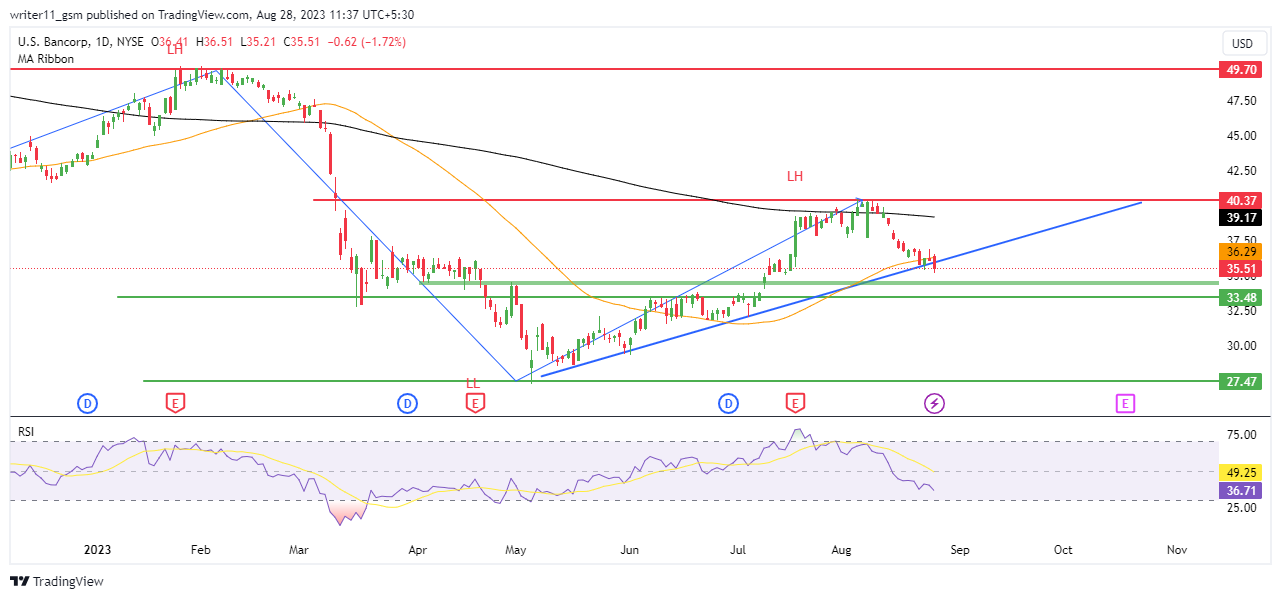
The USB stock price has been falling from the higher levels, creating a lower lows pattern and it has recently rebounded from the previous low point. A double bottom pattern can form if the price stays above the $33.00 level, which could signal a trend reversal for the USB stock.
The weekly charts show a death crossover of the 50-day and the 200-day Exponential Moving Averages(EMA), which is a bearish sign. The price is also falling below the EMAs, indicating a downtrend.
The Relative Strength Index (RSI) for the USB share is above the 50-level and has crossed over the 14-day Simple Moving Average (SMA) line. This could mean a bullish momentum for the stock in the next few days if the RSI stays above 50.
Technical Overview of USB Stock
The stock is bearish on the weekly timeframe, as 14 indicators suggest selling, 9 indicators are neutral, and only 3 indicators recommend buying. This implies that the price might continue to fall.
Conclusion
The stock price of U.S. Bancorp has been dropping from higher levels, showing a downtrend and the EMA is also negative. The RSI is indecisive and the price data of the stock is weak on the charts.
The stock of U.S. Bancorp might keep falling as it has a consistent downtrend and the company’s financial data is also bad. However, a reversal and an uptrend can happen if the market stays above the $33.00 level, otherwise the price will drop further.
Technical Levels
- The support levels for USB Stock are – $27.00 and $33.00
- The resistance levels for USB stock are – $40.00 and $49.00
Disclaimer
The information provided in this article, including the views and opinions expressed by the author or any individuals mentioned, is intended for informational purposes only. It is important to note that the article does not provide financial or investment advice. Investing or trading in cryptocurrency assets carries inherent risks and can result in financial loss.




