
 Dacity Coin
 Celestia
 Pudgy Penguins
 Injective
 Solana
 Sui
Sui Starknet
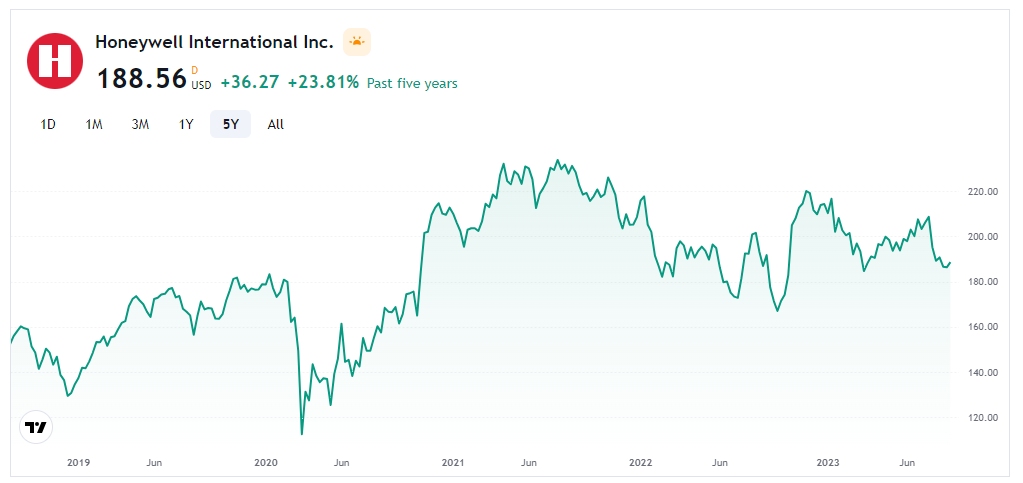
- The last trading session closing price for the HON share was $188.56. It resulted in a decline of $0.96 in price.
- The gross margin for the company has advanced by +15.1% year-on-year.
The dividend paid by Honeywell International Inc. is $3.97 in the year 2022 resulting in a 2.18% dividend yield. The company was founded in 1906. The price-to-earnings ratio of the company is 23.46. It is relatively a good value. It indicates that the stock is fairly valued to its earnings.
The beta of the company is 0.88. That indicates the stock moves relatively less than the whole market. The net income of the company for the year 2022 is $4.966B with a revenue of $35.453B.
The HON stock has 663.961 Million shares floating in the market for trading. The market cap of Honeywell International Inc. has advanced by +16.7% year-on-year. The net cash for the company has advanced by +4.6% year-on-year. The ROA has also advanced by +8.7%. That’s a good indication of the company’s growth.
Honeywell International Inc. Debt Analysis
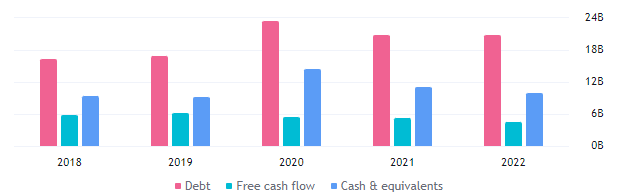
The debt for the HON has slightly declined from $20.63B to 20.54B in the year 2022. It is a positive sign for the company and the free cash flow has declined from $5.14B to $4.51B. That’s not a really good number based on the performance of the company.
HON Technical Analysis
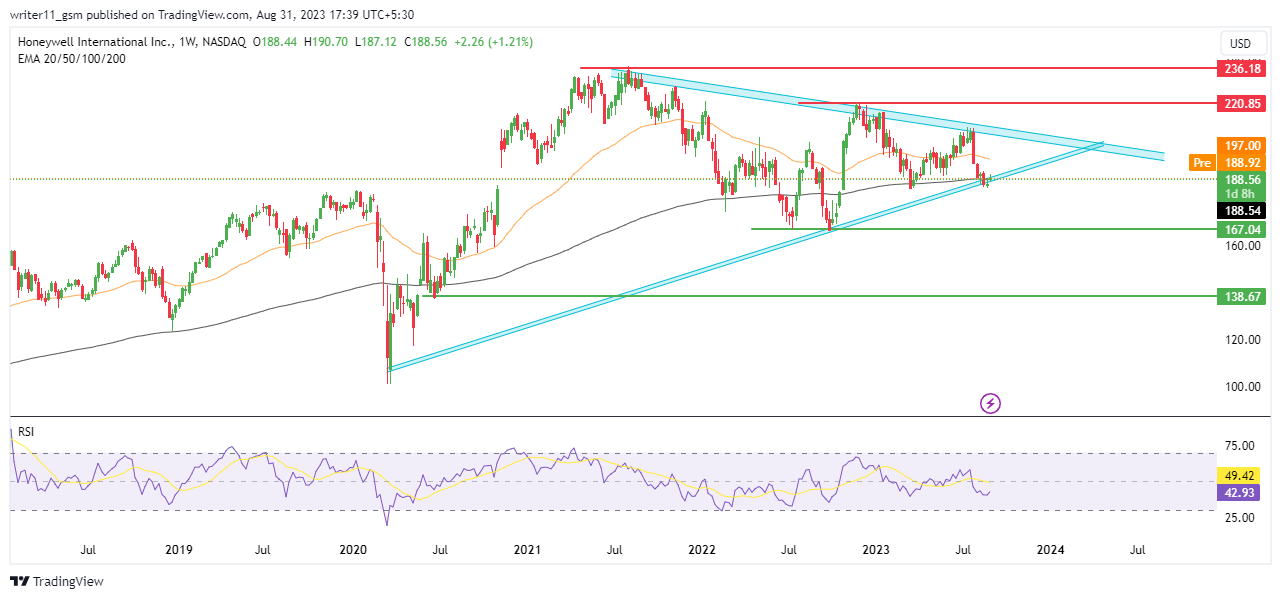
The HON share price had a consistent upward movement from the lower levels. It achieved higher levels but then it changed its direction towards the downside. It started to decline from higher levels leading to the formation of an ascending triangle pattern. The share is on the verge of breaking down below the same which can lead to a further decline in price.
The market is below the 50-day and the 200-day Exponential Moving Averages(EMA). It is a bearish signal and can often lead to death cross if the price continues to decline.
The RSI shows a bearish momentum on the charts as it keeps making lower levels. It has been below the 50 level as it tried to break above the same level. The stock could not sustain which is showing dominance of sellers in the market.
Technical Overview of HON Stock
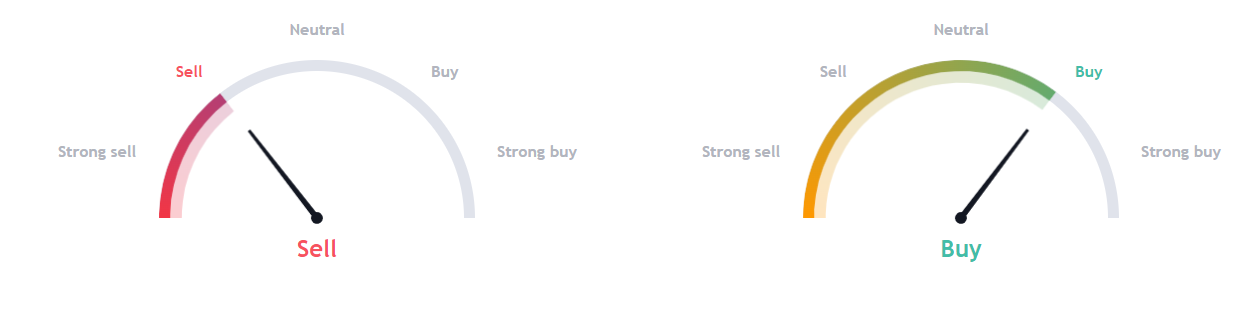
The technical indicators on Tradingview point to uncertainty in the market because the technicals are bearish and the analysts are bullish on the stock.
Conclusion
The Honeywell International Inc. stock price has a bearish trend. It has been consistently declining from the higher levels leading to a breakdown of the ascending triangle pattern. The EMA and the RSI are also acting weak on charts.
Therefore, we can see sellers’ dominance in the upcoming days in the price of the stock.
Technical Levels
- The support levels for HON Stock are – $138.00 and $167.00
- The resistance levels for HON stock are – $220.00 and $236.00
Disclaimer
The information provided in this article, including the views and opinions expressed by the author or any individuals mentioned, is intended for informational purposes only. It is important to note that the article does not provide financial or investment advice. Investing or trading in cryptocurrency assets carries inherent risks and can result in financial loss.




