
 Quack AI
 Pudgy Penguins
 Starknet
 Pearl
Pearl Sui
Sui Celestia
 Quantus
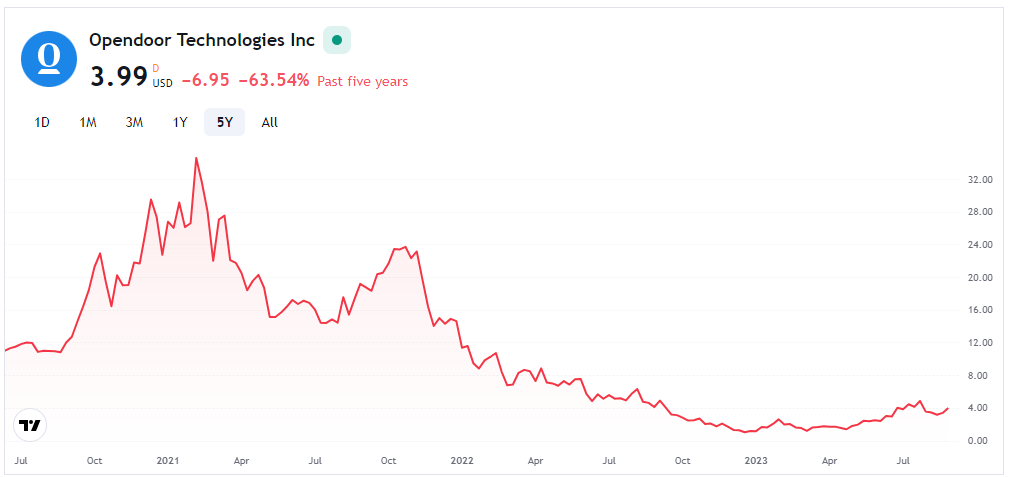
- The last trading session closing price for the OPEN share was $3.98, resulting in an advance of $0.04 in price.
- This company’s gross margin has declined by 34.9% year-on-year.
Opendoor Technologies Inc. has performed well for a long time, but it does not pay any dividends. Being established in 2013, the firm buys and sells real estate. It has 0 price-to-earnings ratio and that’s an insignificant value with no relationship to the stock.
The beta of the company is 4.56. It indicates that the stock moves relatively more than the entire market. The net income of the firm for the year 2022 is -$1.353 billion with a revenue of $15.567 billion.
The OPEN stock has 659.195 million shares floating in the market for trading. Opendoor Technologies Inc.’s market cap has gone down by -11.4% Y-o-Y. The net cash for the company has declined by -1.8% year-on-year. The ROA on the other hand has advanced by +436.2%. It is a good indication of the company’s growth.
Opendoor Technologies Inc. Debt Analysis
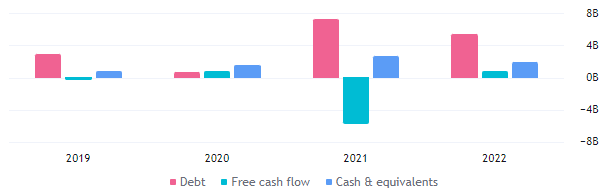
Opendoor Technologies Inc.’s debt slightly grew from $14.68B to 14.96B in the year 2022. It is a negative sign for the company. The free cash flow has declined from $1.26B to $589.77M, which is a bad number based on the company’s performance.
OPEN Technical Analysis
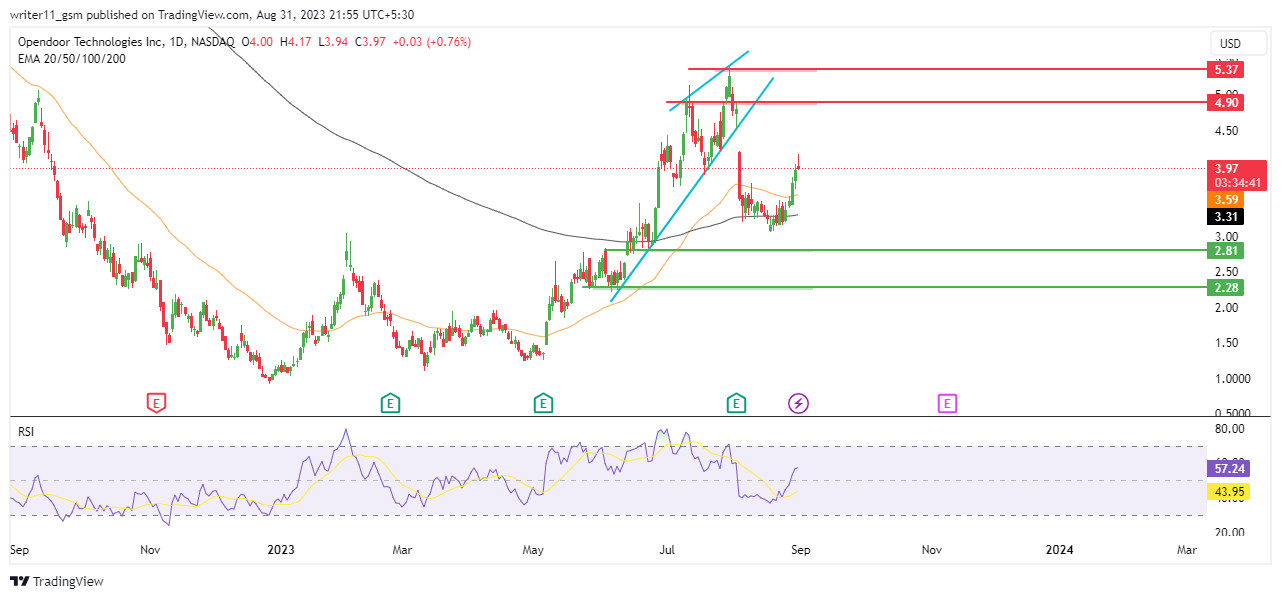
The OPEN share price has consistently advanced from the lower levels. It led to the formation of a rising wedge pattern. The market broke down below the pattern a few days ago. It is regaining traction and showing signs of bullishness.
The market is above the 50-day and the 200-day Exponential Moving Averages(EMA). That indicates a bullish momentum. The stock has been following a preceding golden cross followed by an uptrend.
The RSI shows a bullish momentum on the charts because it keeps making higher levels. It has been above the 50-level and has sustained above the same. It signals the presence of buyers in the market.
Technical Overview of OPEN Stock
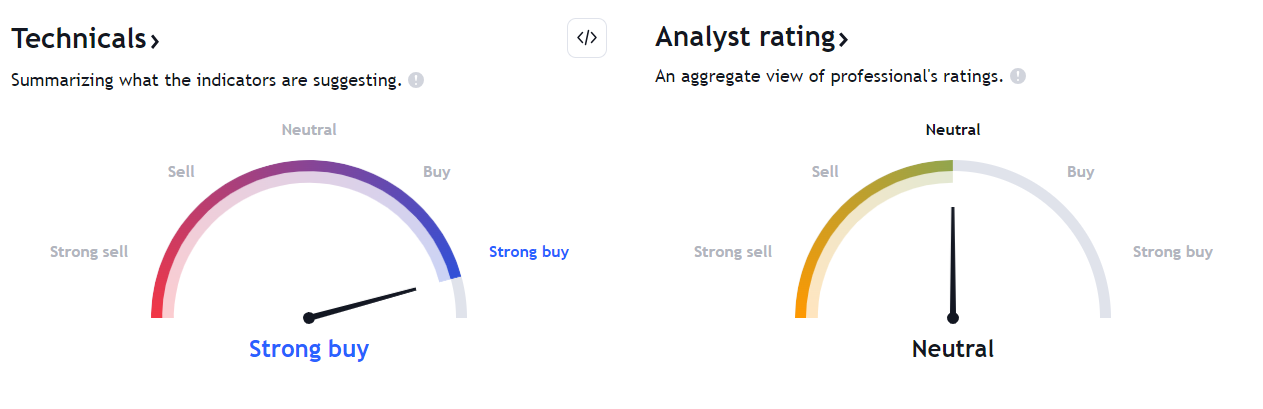
The technical indicators on Tradingview point to uncertainty in the market. The technicals are bullish, but the analysts are neutral on the stock.
Conclusion
The Opendoor Technologies Inc. stock price has been following an uptrend. It is still advancing despite breaking below the rising wedge pattern. The EMA and the RSI are also supporting the upward move.
Therefore, we might see higher prices in the stock, but the price structure is currently uncertain. It means making any kind of position in the stock can be risky.
Technical Levels
- The support levels for OPEN Stock are – $1.25 and $2.80
- The resistance levels for OPEN stock are – $5.30 and $8.00
Disclaimer
The information provided in this article, including the views and opinions expressed by the author or any individuals mentioned, is intended for informational purposes only. It is important to note that the article does not provide financial or investment advice. Investing or trading in cryptocurrency assets carries inherent risks and can result in financial loss.




