
 Dacity Coin
 Celestia
 Quantus
 Bitcoin
 Pearl
Pearl Pons
Pons Injective
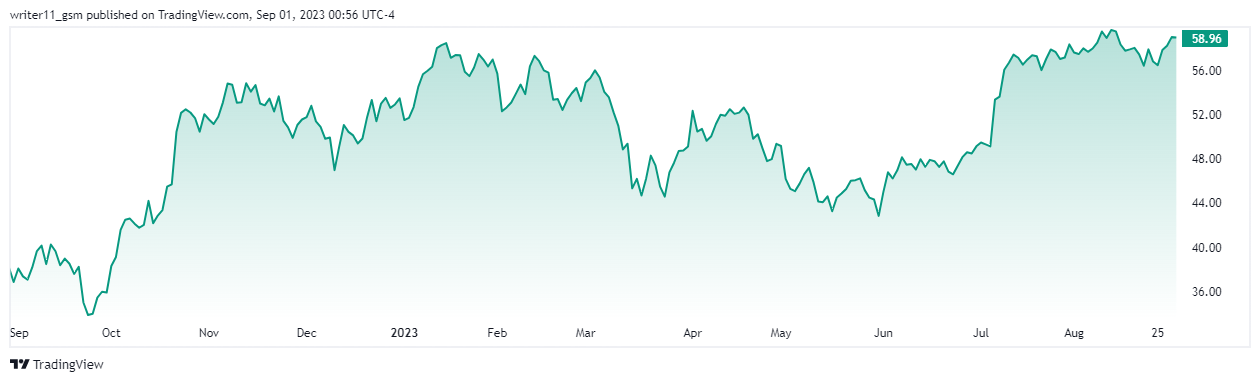
- Schlumberger N.V. price is consistently advancing in an uptrend.
- The EPS for the SLB share is 2.73 and it is trading with an average volume of 9.3M.
The Schlumberger N.V. company’s market cap is $83.793 Billion. The beta for the share is 1.82, which means the share moves relatively higher or equal to the market. This number of floating shares for this firm is 687.54 Million. This firm was founded in 1926 and it works in the Contract Drilling industry.
The stock price has a negative ROE of 30.96%, whereas the ROA for the share is 9.98%. It is a positive sign for the company and the operating margin stands at 17.53%.
The current ratio for the share is 5.34, which is a good sign for the company. It indicates the firm is capable enough to pay its debt. The gross profit margin ratio of the company is 0.33. The market cap of the company has advanced by +38.5% YOY. It indicates an advance in the price of the share.
Schlumberger N.V. Performance Analysis
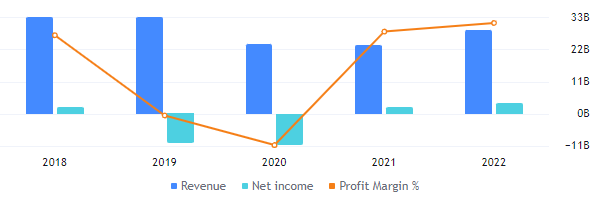
This company’s revenue grew from $22.93 Billion to $28.18 Billion in 2022. There is also a huge advance in net income. It advanced from $1.88 Billion to 3.44 Billion. The EBITDA for the company is 22% and the net income stands at 12%.
SLB Technical Analysis
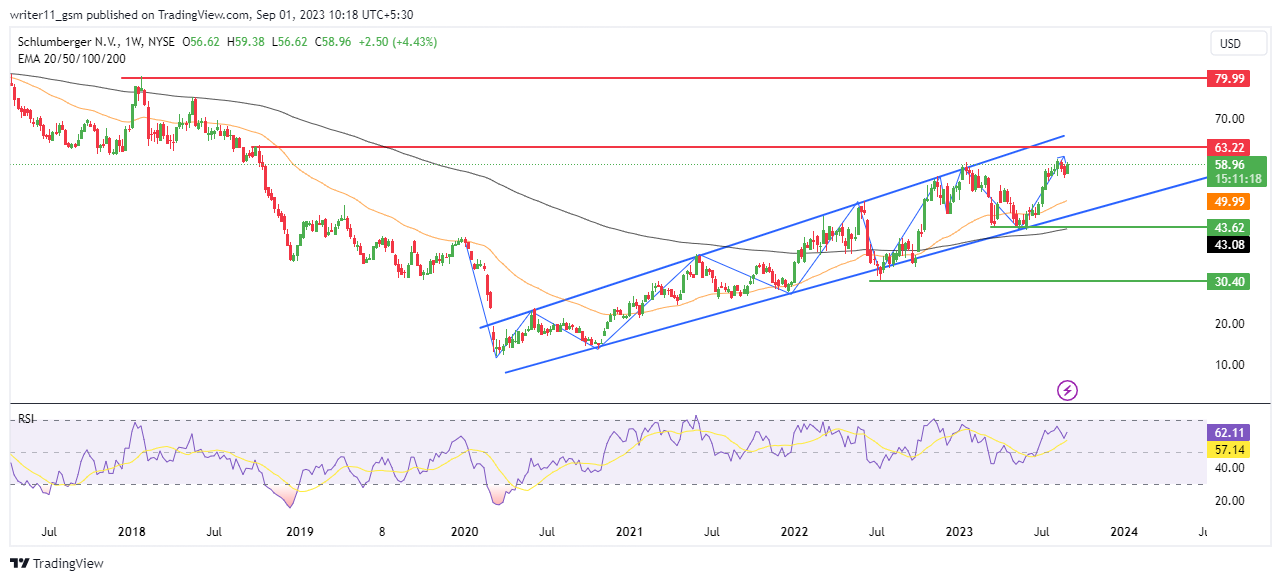
The Schlumberger N.V. share price has been consistently advancing from the lower levels. It led to the formation of higher swing levels, breaking above the previous swing highs. It caused the formation of a rising wedge pattern.
The market has shown a bullish sign on the daily chart. The 50-day Exponential Moving Average has crossed above the 200-day Exponential Moving Average. It is called a golden cross and it suggests that the market is gaining strength. The price may keep rising from the current levels.
The RSI for the SLB share is bullish on charts. It is sustaining above the 50-level and has also crossed above the 14-day SMA line. It indicates the presence of buyers and strong momentum in the market.
Technical Overview of SLB Stock
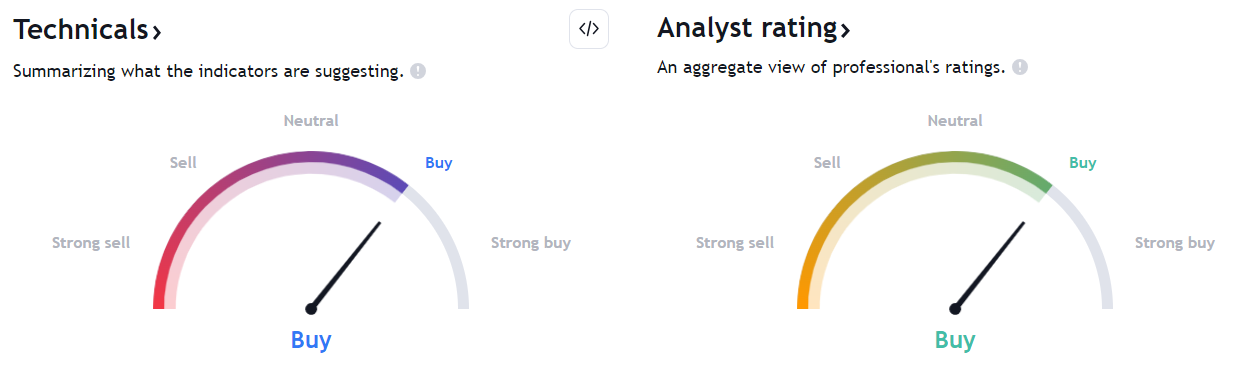
The technical indicators are giving a buy signal. The analysts are also bullish on the stock, which overall indicates an uptrend in the stock.
Conclusion
The SLB stock price has been consistently advancing from the lower levels. It is trading inside a rising wedge pattern. The RSI and the EMA are indicating an up move on the charts.
Therefore, the price of the stock may can continue to advance unless it breaks below the rising wedge pattern.
Technical Levels
- The support levels for SLB Stock are – $30.00 and $44.00
- The resistance levels for SLB stock are – $64.00 and $80.00
Disclaimer
The information provided in this article, including the views and opinions expressed by the author or any individuals mentioned, is intended for informational purposes only. It is important to note that the article does not provide financial or investment advice. Investing or trading in cryptocurrency assets carries inherent risks and can result in financial loss.




