
 Quantus
 Injective
 Bitcoin
 Quant
Quant Pudgy Penguins
 Raydium
 Bittensor
- The fundamental analysis of CTY stock’s financials and its portfolio
- The stock has seen a spike after touching its support level. It is currently near its immediate resistance
- The stock has been in consolidation since 2021. See the levels to buy in the present time
The City of London Investment Trust was founded in 1861. It is currently one of the biggest closed-end mutual funds that majorly invests in UK securities. The company is listed on the London Stock Exchange with the ticker named ‘CTY’. Laurie Magnus is the chairman of the City of London Investment Trust.
Fundamental analysis of CTY stock
Our financial analysis will be based on two parts. For the financial position of the investment trust as a firm, we will take a look at the Income statement and balance sheet. The second part will cover the investments and allocations held by the fund.
Financial statement analysis
A close-ended mutual fund’s income statement is different from the usual companies because there are no Costs of goods and Heavy operational costs. Coming in the Income statement, the total revenue consisting of gains on Investments and income from the investments, was £112 Million. This amount is 1.5 times less compared to the previous year.
Furthermore, The operational income came up to £105 Million after some operational expenses of £777k. It mainly consists of auditing services, marketing, listing fees, and the fund managers’ management fees of £5.8 Million. however, the company is also taking regular consultation and advisory, considering the nature of the business. After some finance costs of £4 Million, the company paid taxes of £1.2 Million. In 2022, the CITY of London Investment Trust made a net income of £99.2 Million. It is 167% less than the net income of 2021.
Just like the income statement, the balance sheet of the CITY of London Investment Trust is also a little different from the usual companies. Instead of heavy fixed assets, the only long-term assets of the company are the Investments. Those investments increased by 4.3% as compared to the previous year.
In the current assets section, the company has debtors of £11.45 Million. The current liabilities of the firm are £11.38. It makes up the current ratio of 1.0. However, the current ratio was far better in 2021 at 2.4. In the long-term liabilities section, the company does not have long-term debt, as expected from a closed-end fund.
Fund and portfolio analysis
At the end of 2022, the company as a fund had given a total Net asset value (NAV) return of 7.5%. It was 5.9% ahead of the FTSE 100. Along with that, the dividend was increased for the 56th consecutive year by 2.6%.
The company’s portfolio as a fund is pretty diversified with strong and stable stocks constituting the highest percentage. The majority of the investments, 39% are in the sectors like FMCG, Real estate, and Finance. The next 35.5% are defensive stocks in sectors like healthcare and utility. leaving the last 25.4% for sensitive allocation of the Energy sector, Tech companies, and industrial giants.
| Top 10 holdings of The CTY of London Investment Trust plc | |||
| S.no | Stocks | Country | % of assets |
| 1 | Shell PLC | United Kingdom | 4.02 |
| 2 | Unilever PLC | United Kingdom | 3.97 |
| 3 | HSBC Holdings PLC | United Kingdom | 3.68 |
| 4 | BAE Systems PLC | United Kingdom | 3.65 |
| 5 | British American Tobacco PLC | United Kingdom | 3.51 |
| 6 | RELX PLC | United Kingdom | 3.37 |
| 7 | Diageo PLC | United Kingdom | 3.37 |
| 8 | AstraZeneca PLC | United Kingdom | 3.28 |
| 9 | BP PLC | United Kingdom | 3.08 |
| 10 | Imperial Brands PLC | United Kingdom | 2.67 |
With 100% investment in the developed market and stocks, the company is focused on stable capital growth with dividends rather than emerging risk-averse investments. Furthermore, most of the investments are in the United Kingdom itself with a share of 82% of the total. Next on the list are European securities at 5.53% and US securities at 4.55%
Technical analysis and price prediction for the CTY stock
The CTY stock price has been in a deep consolidation since March of 2021. The stock has seen a cycle of bullish and bearish trends. The bears and the bulls are tussling between the zone of £373 and £427.
At present, the CTY stock is trading at the level of £394 and is seen bouncing off its immediate support level of £385. The current price is near the immediate resistance of £399. Furthermore, the second support and resistances for the CTY stock await at £373 and £409 respectively.
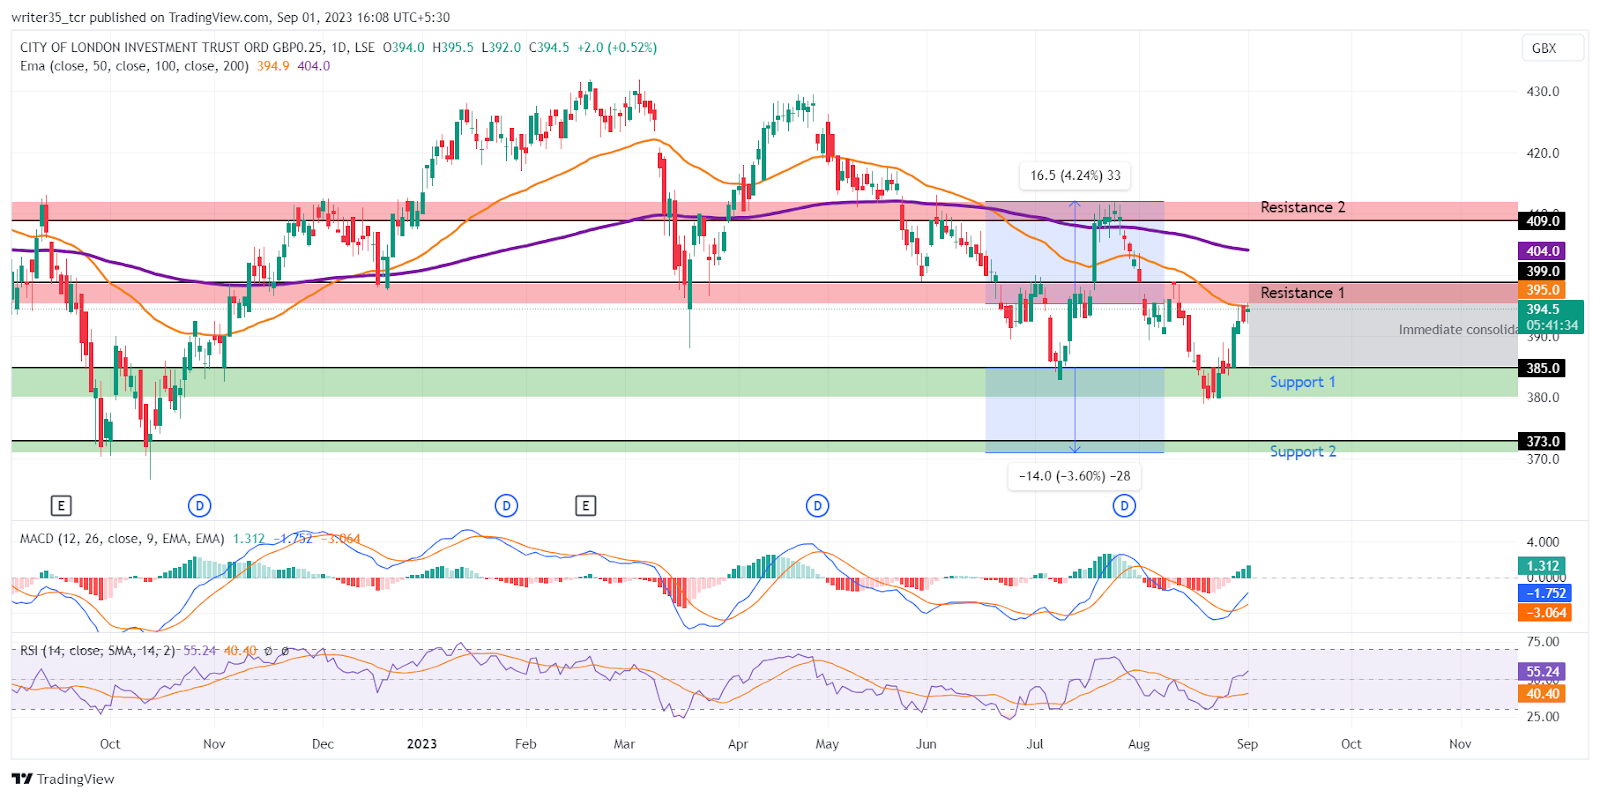
Between these supports and resistances, indicators like MACD are showing a bullish crossover with its EMA at the end of this August. The MACD and its EMA are currently at levels of -1.7 and -3.06. The RSI is on the rise after touching its oversold level of 30 at the end of August this year. The RSI is currently in a neutral territory of 53. Furthermore, the EMAs are above the current price. The 50 EMA is at the level of £395 and the 200 EMA is up above £404.
Is the City of London Investment Trust a good buy?
The City of London Investment Trust has seen declined revenue for a few years. However, the balance sheet of the fund seems strong. The majority of its investments are well-diversified in various sectors and economies. Furthermore, the company has no long-term debt. As a fund, the performance has been decent over the years. A long-term investment can be made in the CTY stock.
As per trading in the short term, the prediction will be bullish if the bulls can break past their immediate resistance. Currently, the 50 EMA is up close to the resistance level and so is the share price. A good momentum will be required to break past both of them. Traders should buy the stock if it sustains above £399.
Technical Levels
Support:£385, £373
Resistance: £399, £409
Disclaimer
The views and opinions stated by the author, or any people named in this article, are for informational purposes only. They do not establish financial, investment, or other advice. Investing in or trading crypto assets comes with a risk of financial loss.




