
 Quack AI
 NEAR Protocol
 Zcash
Zcash Celestia
 Pons
Pons Pudgy Penguins
 Bitcoin
- The price of Dell Technologies has been consistently advancing from the lower levels and has shown a spike of +20.10% in the last trading session.
- The dividend yield by the company is 2.17% leading with a PE ratio of 21.75.
The Beta for the DELL share is 1.41 which often means that the share price moves equal to or a bit more than the overall market. This leads to 253.413M floating shares of the company available for trading in the stock market.
The dividend yield per share by the company for the financial year 2022 is 1.32 and the total dividend yield by the company for the year 2022 is 2.05%. The company has a shocking negative debt/equity ratio of -2967.20% which might can affect the company in a negative manner.
The Dell Technologies was found in the year 1984 and works in Electronic Technology sector and has 133K employees world wide. The current CEO of the company is Michael Saul Dell.
Dell Technologies Inc. Debt Analysis
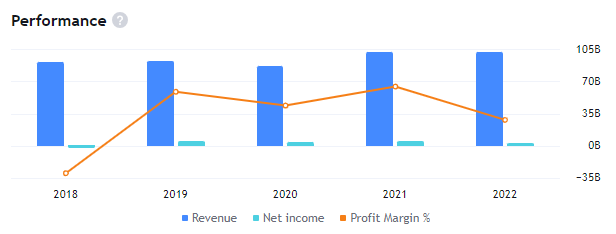
DELL share has shown a very slight advance in revenue resulting in $101.56B for the year 2022 but the net income of the company has declined to $2.44B from $5.56B. The EBITDA for the company stands at 9% out of the total revenue of the company.
DELL Technologies Technical Analysis
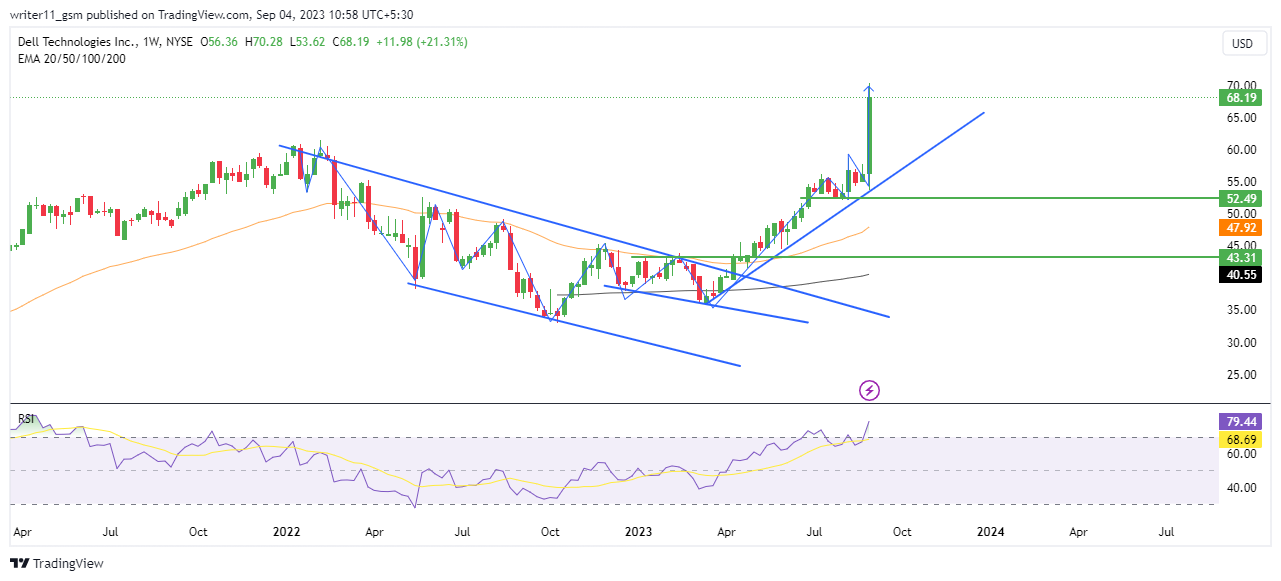
On the weekly timeframe the price of the share was decclining making lower lows leading to the formation of the falling wedge pattern and once the price broke out above the same it lead to huge momentum has is still advancing breaking out above the all-time high. This is a sign of presence of buyers in the market.
The share is trading in a golden cross of the 50-day and the 200-day Exponential Moving Average which indicates bullishness in the market as the share is trading above the following EMA’s and the price is consistently advancing.
The RSI for the stock is trading above the 70-level which denotes the huge presence of buyers in the market as the price has advanced to the higher levels and has pushed the RSI above the overbought zone.
Technical Overview of DELL Stock
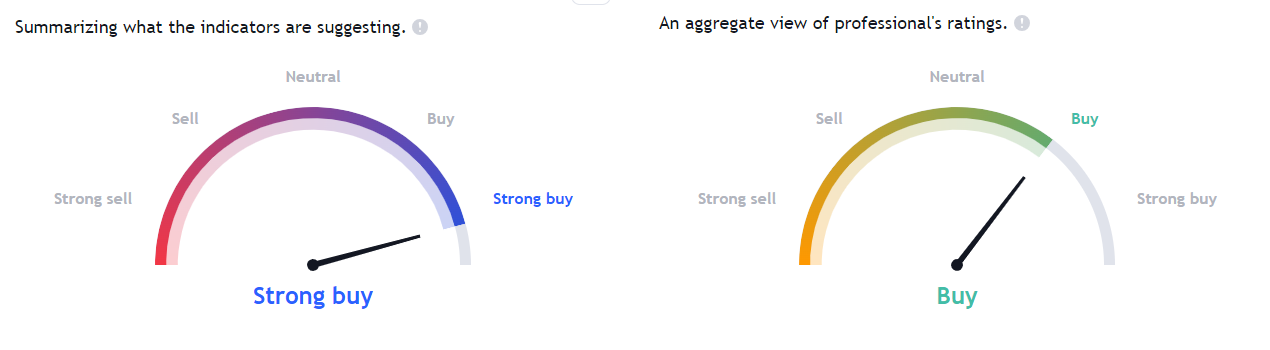
The technical analysts following the technical indicators are bullish on the stock as the price data. and the indicators following different time frames are bullish for the stock.
Conclusion
The stocks, market structure is extremely bullish as it has broken out above the all-time high. and the technical indicators like EMA and the RSI are also bullish on the charts. The price data and the fundamentals of the company are also strong.
Therefore, the price of the share may continue to advance to a higher level in the future.
Technical Levels
- The support levels for DELL Stock are – $43.00 and $52.00
- The resistance levels for DELL stock are – $80.00 and $100.00
Disclaimer
The information provided in this article, including the views. And opinions expressed by the author. or any individuals mentioned, is intended for informational purposes only. It is important to note that the article does not provide financial or investment advice. Investing or trading in cryptocurrency assets carries inherent risks and can result in financial loss.




