
 Quack AI
 Lighter
 NeoSoul
 Pearl
Pearl Quant
Quant Injective
 Pons
Pons
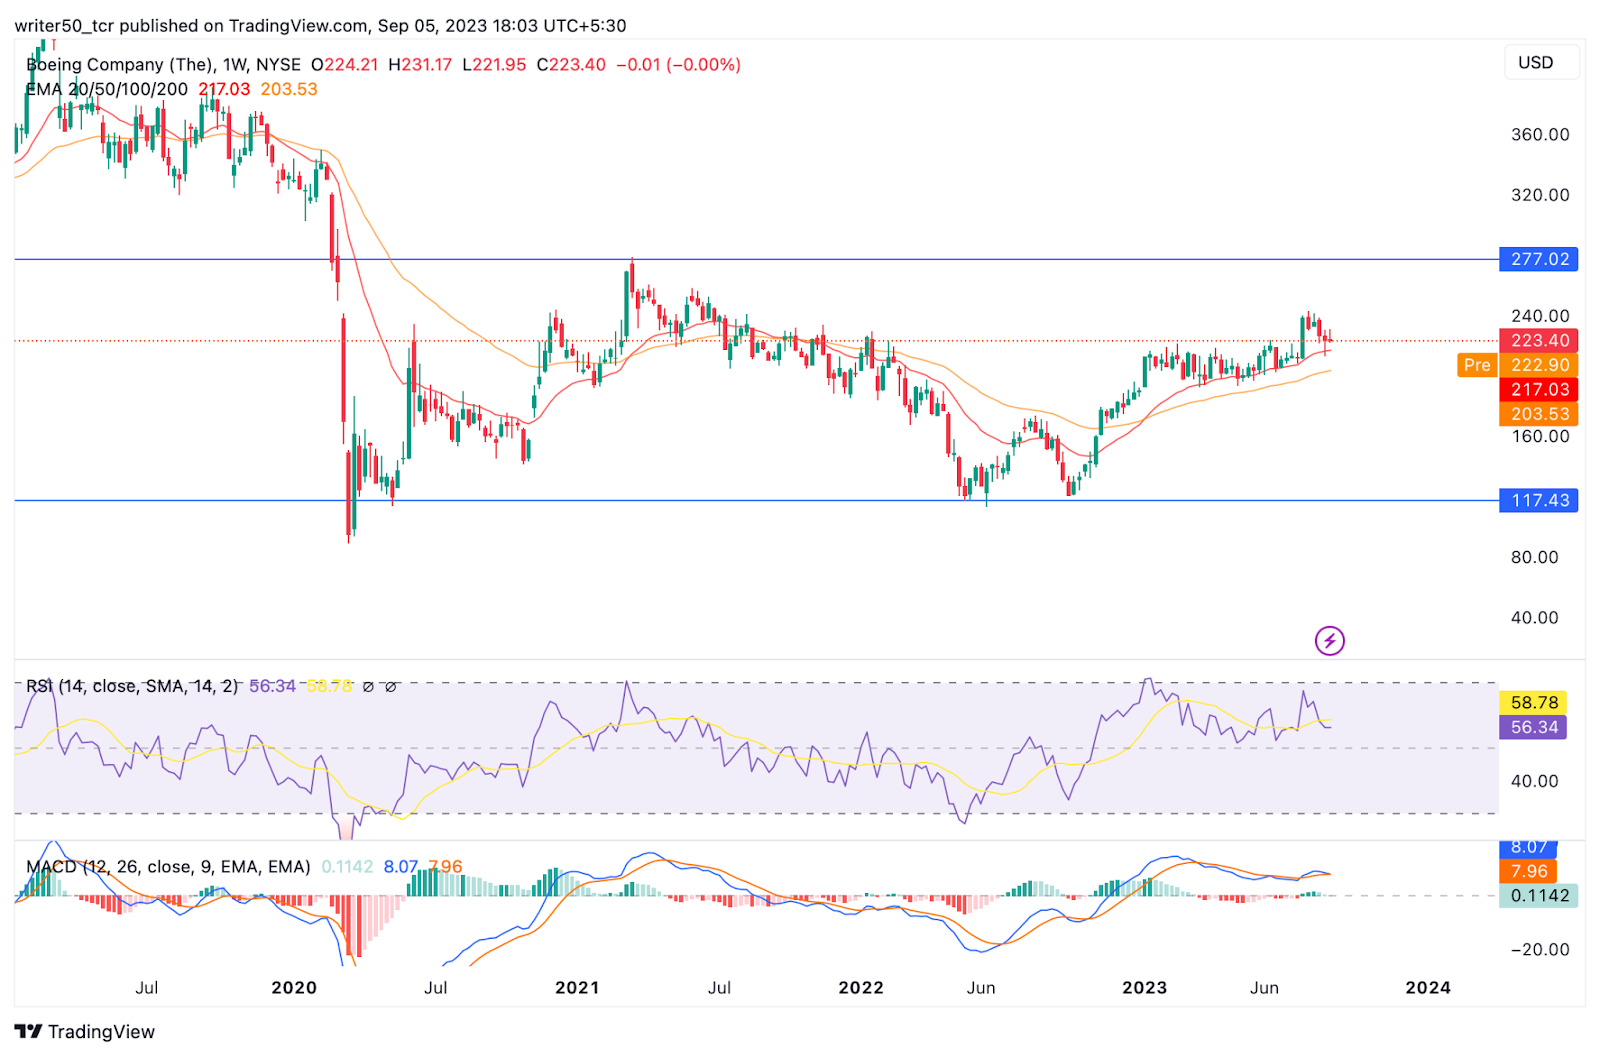
- BA Company Inc.’s stock is above the 50 and 100-day EMA.
- Boeing Company Inc.’s (BA) price is $223.40.
Boeing Company stock is moving in an uptrend direction. The price of the BA stock is reaching greater heights on a weekly basis.
The beta factor for the stock is 1.5. The 52-week high of BA is $243.20 and the 52-week low is $120.99.
The stock has made an all-time high of $444.1 In february 2019.Boeing Company Inc. (BA) stock made an all-time high of $444.10 in February 2019. Then the price started declining. The price declined by 80.6% by the end of 6 September 2020.
The BA stock found support at the $115 level. Since then, the price of BA has rebounded.
The stock price is currently trading in a parallel channel pattern. The overall pattern of the BA stock is bullish and the price may break through its resistance to create a new swing high.
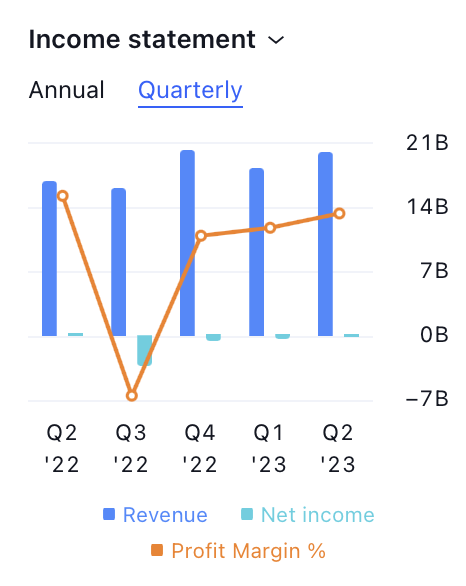
The profit margin of the BA stock is increasing per quarter as per the income statement. This reveals that the financials of the company are strong.
The price of BA has increased by over 43% IN ONE YEAR. This suggests that a bullish momentum is present for the BA stock. It is very likely that BA’s pricing will increase.
Boeing Company Inc. (BA) Stock Price Analysis
EMA
Boeing Company stock is currently trading above the 50-day and 100-day EMA levels. This is a positive indication and the price is likely to rise in the future.
MACD
The MACD line for the BA stock is above the signal line. Also, there is a green bars formation in the stock. This suggests that BA stock is in a bullish momentum and the prices may increase in the next few days.
RSI
The 14-day SMA and the RSI line for BA stock are close to 70. This is a positive indication. A further rise in the stock price is expected in the upcoming days.
Conclusion
As per the analysis, the price of Boeing Company Inc. stock (BA) is in upward momentum. The revenue of the stock is increasing along with the profit margin. The Boeing Company is making a positive structure and the earnings are also rising.
Therefore, if the price continues to move in an uptrend direction and breaks the resistance level, a further up move is expected in the upcoming days.
Technical Levels
- Support Level: $117
- Resistance Level: $277
Disclaimer
The views and opinions of the author, or anyone named in this article, are for informational purposes only. They do not offer financial, investment, or other advice. Investing or trading crypto assets involves the risk of financial loss.




