
 Injective
 Pudgy Penguins
 Quantus
 Bitcoin
 Celestia
 Sui
Sui Derive
- LINK price is below the 100-day EMA levels.
- LINK price has a market capital of $3.2 Billion.
- The total circulating supply of the LINK is 538.1 Million.
Link is a cryptocurrency that aims to connect traditional finance, real-time data, APIs, and smart contracts on the blockchain. Chainlink was founded in 2017 by Steve Ellis and Sergey Nazarov.
The LINK coin has a market value of $3.2 Billion. The coin trades at $130.4 Million in a day. The highest price that the LINK coin reached in the past 52 weeks was $9.37 and the lowest was $4.98. The coin has a total supply of 1,000,000,000 LINK.
The daily market data shows that the Chainlink (LINK) coin price is going up.
Chainlink’s price hit a high of $53 in May 2021 and then it started to fall. The price dropped by 90% in a year and bounced back from the $5.4 level.
The price could not break the $8 resistance level despite many tries. Price has finally surged with high volume after being stuck in a sideways range for more than a year.
LINK’s price has gone down by 15.32% in the past 30 trading days. The price is forming a weak pattern and the price is expected to fall more in the upcoming days.
Chainlink (LINK) Price Technical Analysis
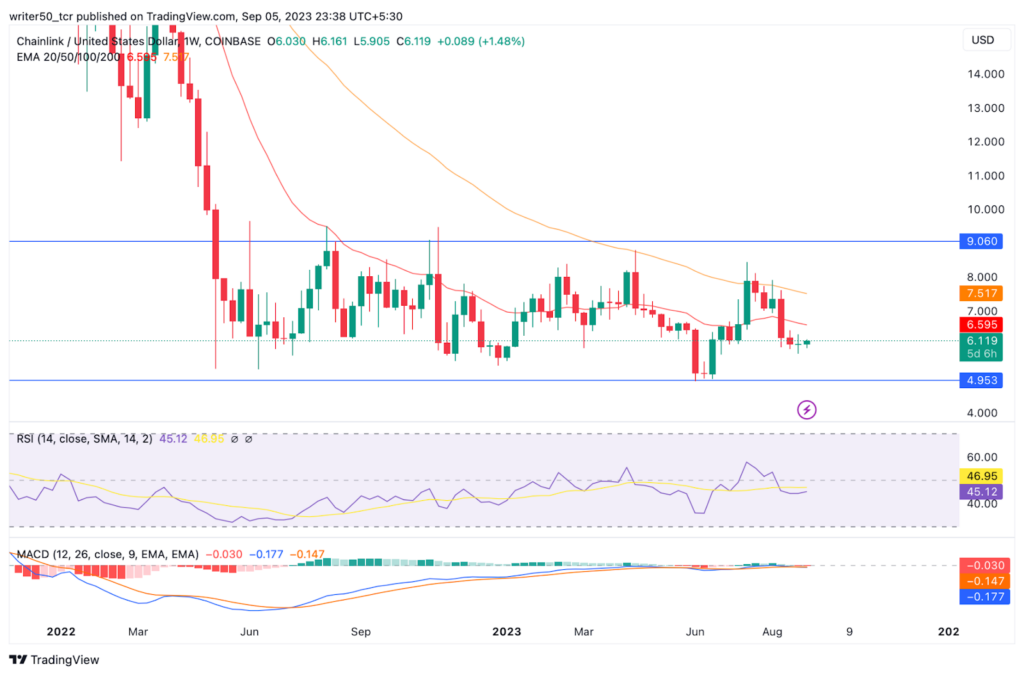
EMA:
The Chainlink price is below the 100-day EMAs on a weekly chart, which shows a bearish trend. The Chainlink price is likely to decline in the future.
MACD:
Additionally, the MACD indicator gives a bearish signal in the weekly time frame. Both the MACD indicator and the signal indicators are below the 0 line at -0.47 and -0.54, respectively. A negative MACD indicates that there will be a bearish movement.
Volume Analysis:
The 24-hour trading volume for ChainLink (LINK) is $130.4 Million. In a day, there has been a decrease of 4.5%. The fact that the volume is falling suggests that investors’ interest in the coin is decreasing. It points towards a price fall taking place soon.
Conclusion
The analysis shows that Chainlink’s price has a strong force which could lead to more price increases in the future. The main reason for the bullish signs is the formation of a better price pattern. Indicators like MACD, RSI, and EMA confirm this view. These technical signals suggest they may be on a rising trend.
Technical Levels
- Support Level: $4.9
- Resistance Level: $9.05
Disclaimer
The views and opinions of the author, or anyone named in this article, are for informational purposes only. They do not offer financial, investment, or other advice. Investing or trading crypto assets involves the risk of financial loss.




