
 Pearl
Pearl Bitcoin
 NEAR Protocol
 Starknet
 Solana
 Quant
Quant Ondo
Ondo
- The AGNC share price is trading inside a rising wedge pattern.
- The EPS for the AGNC Investment Corp. is -0.26 USD. It means that the company is losing 0.26 USD for each share in the market.
The current market cap of the company is $6.037 Billion. The beta for the firm is 1.28 which makes the stock more volatile than the market as a whole. The total number of floating shares in the company are 606.077 Million. It means these shares are available for trading in the stock market.
The company was founded in 2008 and operates in the finance industry. The ROE for the share is -9.31%, which is a negative sign! However, the ROA is neutral and the company has a really strong debt/equity ratio of 748.45%.
The gross profit margin of AGNC Investment Corp is 0.03 and the net profit margin is 1.48. That is not a figure the company may want! This company’s market cap has advanced by +4.2% year-on-year. It shows the advance in the stock’s price.
AGNC Investment Corp. Company Performance Analysis
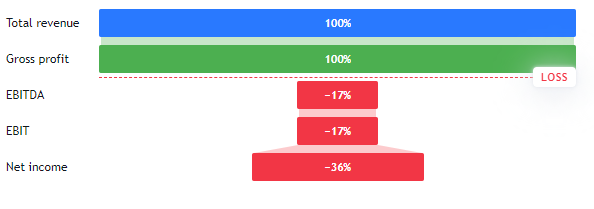
The AGNC has made a total revenue of $3.30 Billion in 2022. The gross profit of the company stands at 100%. Its net income has shown a massive decline of 1.93 Billion USD, which is not good for the further growth of the company.
AGNC Technologies Technical Analysis
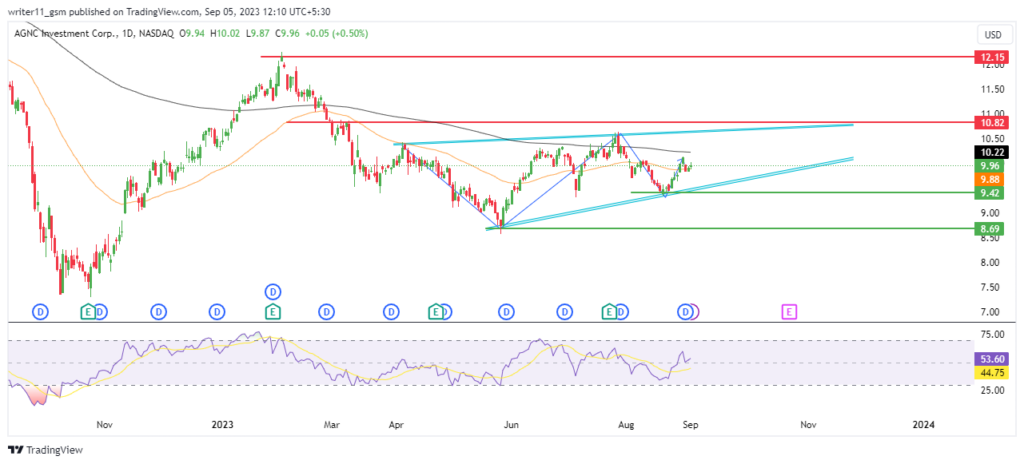
The AGNC share price is creating higher peaks as it forms a rising wedge pattern because of steady increases in price from the bottom levels. The stock price is still moving within the same pattern. Any break below it can cause a shift in the direction of the stock.
Since the stock has declining consistently for a very long time following a downtrend, the market has been following a preceding downtrend. The 50-day and the 200-day EMAs are trading in a death crossover. It indicates bearishness and the presence of sellers in the market.
The RSI for the ANGC is trading above the 50-level. However, it is lacking momentum because it did not hit either of the overbought or the oversold zone in the charts.
Technical Overview of AGNC Stock
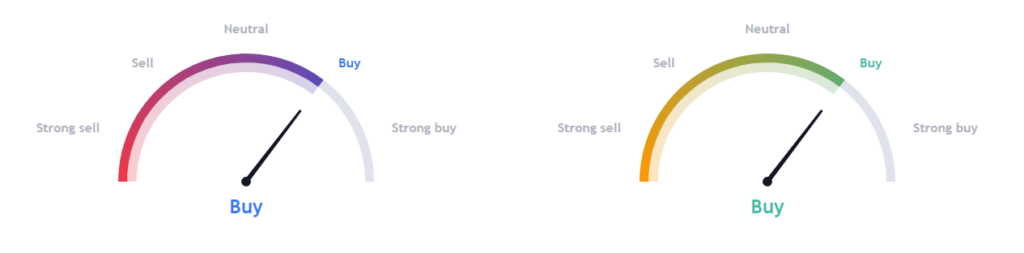
Using Tradingview’s summary analysis tool, we can observe that most of the indicators, such as EMA’s and various oscillators, are bullish for the stock. Professional analysts also have evaluated the current financials and they are also bullish on the stock.
Conclusion
The market structure for the AGNC Investment corp. share looks uncertain as the market is trading inside a rising wedge pattern. The EMA is acting bearish while the RSI is mildly bullish.
Therefore, the share’s price may continue to advance unless it breaks below the rising wedge pattern.
Technical Levels
- The support levels for AGNC Stock are – $8.60 and $9.40
- The resistance levels for AGNC stock are – $10.80 and $12.00
Disclaimer
The information provided in this article, including the views and opinions expressed by the author or any individuals mentioned, is intended for informational purposes only. It is important to note that the article does not provide financial or investment advice. Investing or trading in cryptocurrency assets carries inherent risks and can result in financial loss.




