
 Dacity Coin
 Pearl
Pearl Bitcoin
 Sui
Sui Quantus
 Injective
 Zcash
Zcash
- The coin has broken all the past support levels and is trading near its all-time low that was made in July this year.
- The coin’s price is moving towards its first resistance as it makes a new support level.
- The MACD has confirmed a bullish crossover with its EMA.
At the end of 2022, the BAT coin experienced a dip in its price, reaching its low point of $0.162 in December last year. However, fast forward to January 2023, the coin’s price started to rise again, showing a bullish trend that would continue throughout the month. During this time, the coin broke a significant resistance level of $0.2168, which helped to fuel the upward trend.
BAT Coin Price Technical Analysis and Prediction
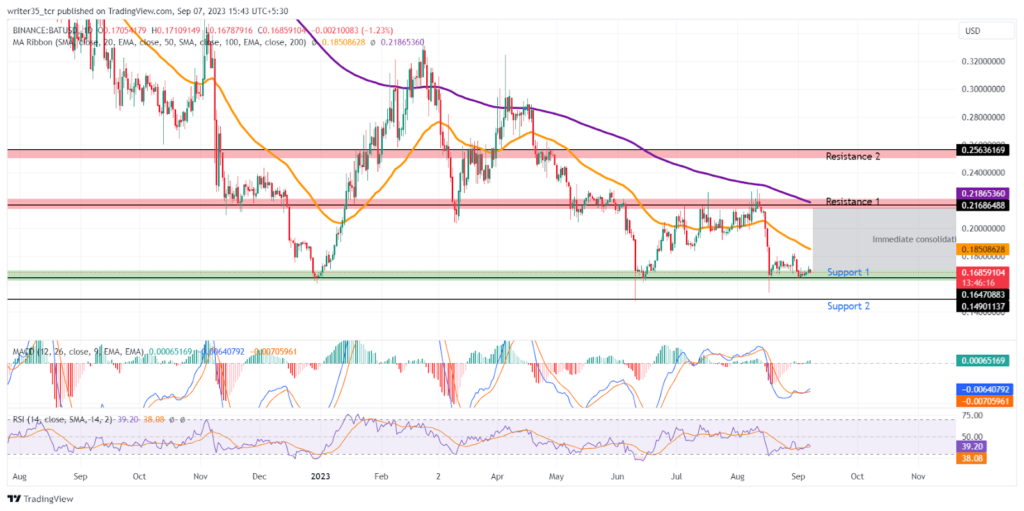
As February rolled in, the BAT coin continued to rise, breaking yet another resistance level of $0.25 early in the month. This upward trend continued, leading the coin to reach its year-to-date high of $0.336. This was an impressive achievement, especially considering the previous low point that the coin had reached just a few months before.
The value of the BAT coin has experienced a decline and has been breaking through support levels continuously since reaching its peak level in February. In the month of June this year, the coin also hit its year-to-date low, falling to $0.1479. At the moment, the BAT coin price is trading around $0.1681 and is being supported at the $0.1647 level. The second support level is at $0.1490. Taking into account the current market conditions, the immediate resistance for BAT coin price is at $0.2168, while the second resistance level is at $0.256.
What are the indicators showing?
Apart from supports and resistances, indicators like Moving Average Convergence Divergence (MACD) are showing a slight bullish crossover with its Exponential Moving Average (EMA). This means that the MACD line, which currently stands at -0.006, is on the verge of making a sustainable crossover with its EMA, which is at a slightly lower level of -0.007. If this crossover sustains, it could give the required strength to the bulls.
On the other hand, the relative strength index (RSI) has also made some changes in recent times. After touching its oversold levels of 30 in August, the RSI has spiked and is currently at 38. However, it is still struggling with its Simple Moving Average (SMA) line, which indicates that there may be some resistance present in the market.
The EMAs of the BAT coin price are seen rejecting the bulls since the coin is in a deep downtrend. The 50 EMA is above the price at the level of $0.1851 while the 200 EMA is above the immediate resistance zone, at the level of $0.21686.
Conclusion
The price prediction for BAT coin appears to be bullish, with indications that the bulls have the potential to regain its support level. With confirmation from the indicators, the next target for BAT coin’s price could be its immediate resistance at $0.2168.
Technical Levels
Support:$0.1647, $0.14901
Resistance: $0.21686, $0.2563
Disclaimer
The views and opinions stated by the author, or any people named in this article, are for informational purposes only. They do not establish financial, investment, or other advice. Investing in or trading crypto assets comes with a risk of financial loss.




