
 Dacity Coin
 Celestia
 Quantus
 Bitcoin
 Pearl
Pearl Pons
Pons Injective
- The stock has been in a consolidation phase since last year.
- The bulls have taken control as the stock seems to take a rebound from its immediate support level.
- The MACD and RSI are on the verge of crossovers.
Exelon Corporation (NASDAQ: EXC) stock experienced a huge drop in its price in October of 2022 when it broke its major support level of $41.2. This caused the price to fall to a level of $35.19. Although the bulls attempted to regain control, they were unable to surpass the previous level of $ 41 because of lower bullish momentum. As a result, the stock has been stuck in a consolidation zone since November of last year.
Fundamentally, the company has been reporting negative growth in its revenue from 2019. However, in 2022, there was a glimmer of hope for investors as Exelon reported a revenue of $19 Billion with a growth of about 6%. This growth was followed by its net profit of $2.17 Billion. The company is giving regular dividends per share of about $1.5 on average. With a dividend payout ratio of over 70% on average, it is safe to say that Exelon is focused on stability rather than growth.
EXC Stock Price Technical Analysis and Prediction
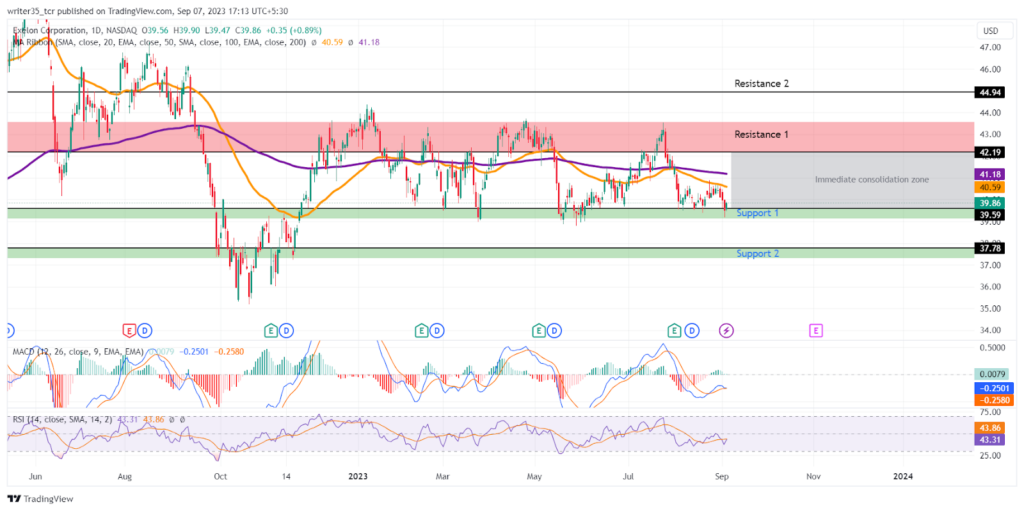
As of now, the price of EXC stock is hovering around $39.8 and appears to be attempting to regain its immediate support level of $39.59. This price level is important for traders and investors to keep an eye on, as a break below it could signal a potential bearish reversal. On the other hand, a successful bounce off this level could lead to a bullish rally.
In terms of support levels, the EXC stock price has a second support level at $37.7, which is a crucial level to keep in mind in case the price falls below its immediate support level. Similarly, a second resistance after the immediate one is at $44.9
What are the indicators showing?
After supports and resistances, indicators like the MACD are at the same level as their EMA. After making a bullish crossover back in August of this year, both the lines are presently at the same level of -0.25. This indicates a neutral trend for the stock price.
On the other hand, the relative strength index (RSI) is on the verge of making a bullish crossover with its simple moving average (SMA) line, with both of them being at a point of 43. This crossover could potentially indicate a bullish trend for the stock price.
The EMAs of the EXC stock price are giving rejection to the bulls during the consolidation phase. Currently, the 50 EMA is on the level of $40.5 while the 200 EMA is above it, at $41.2 The bulls have to exhibit some momentum to get past these two EMAs for the start of a bullish rally.
Conclusion
The EXC stock price prediction leans towards a bullish outlook. The support level appears robust, and the bulls seem to be regaining control. However, for a confirmed bullish trend, they will need to overcome the hurdles presented by the 50EMA and the 200EMA. If they succeed, the next target for the stock would likely be its immediate resistance level.
Technical Levels
Support:$39,5, $37.7
Resistance: $42.1, $44.9
Disclaimer
The views and opinions stated by the author, or any people named in this article, are for informational purposes only. They do not establish financial, investment, or other advice. Investing in or trading crypto assets comes with a risk of financial loss.




