
 Quack AI
 NEAR Protocol
 Zcash
Zcash Celestia
 Pons
Pons Pudgy Penguins
 Bitcoin
- FCIT stock has been in a solid downtrend throughout the year.
- F&C Investment Trust released its H1-2023 financial report on 3 August 2023.
- FCIT stock slid 0.23% and is trading at £869 during the intraday session.
FCIT stock has been falling since the start of 2023, indicating a downtrend trajectory throughout the year. The stock experienced a consolidation between £922 and £881 from March to May 2023. The stock price then broke out and formed a support level of £651 on 27 June 2023.
After a slight pullback rally, FCIT stock price dropped further toward the £840 support level. Furthermore, the bullish trend caused the price to surge by 6% and retested the £895 level. Due to the heavy presence of bears at that level, the price fell again, breaking the previous support of £840 and forming an annual low of £834.
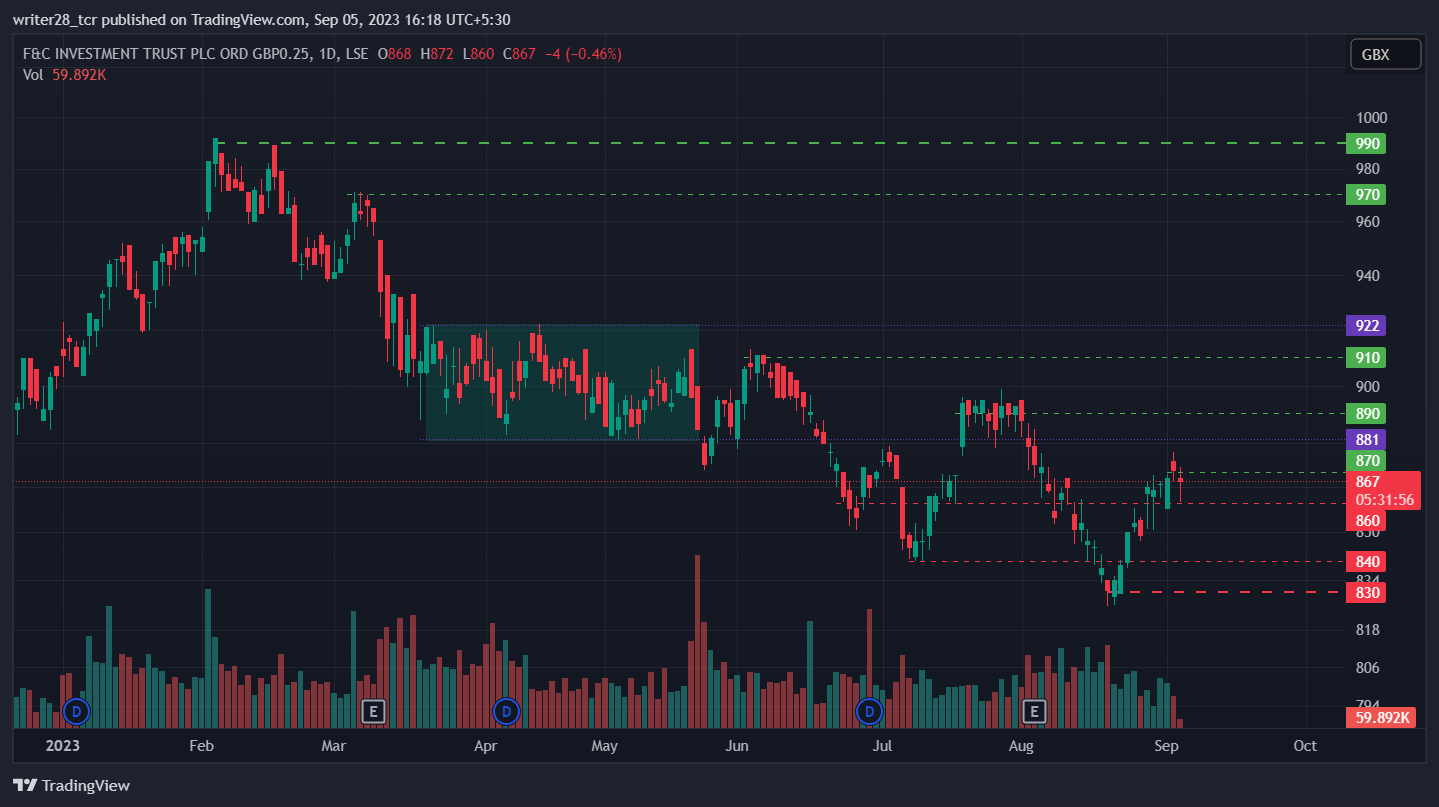
The bulls are currently marching in full force with a desire to conquer the £899 mark again. However, the ongoing downtrend represents the price constantly forming lower lows and lower highs. If the bulls succeed in their mission and retest the £899 level, this would be the first time that the downtrend gets rejected.
On the contrary, if this spike represents only a short-term pullback and does not break the significant psychological level of £899, the FCIT stock price will fall back towards the annual low or maybe even lower towards the £820 mark.
H1-2023 Financial Report Of F&C Investment Trust
F&C Investment Trust PLC released its first half-yearly financial report on 3 August 2023. Based on the report, the revenue of the first half of the year was £204.6 Million with a net income of £58.4 Million. Moreover, the estimated EPS for H1-2023 was £0.3548, while the reported EPS was £0.3949.
Recently, FCIT stock has been trading at £869 while witnessing a loss of 0.23% during the intraday session. The market capitalization of F&C Investment Trust PLC is £4.467 Billion, with an average volume of 268.85K shares.
Will FCIT Stock Retest £899?
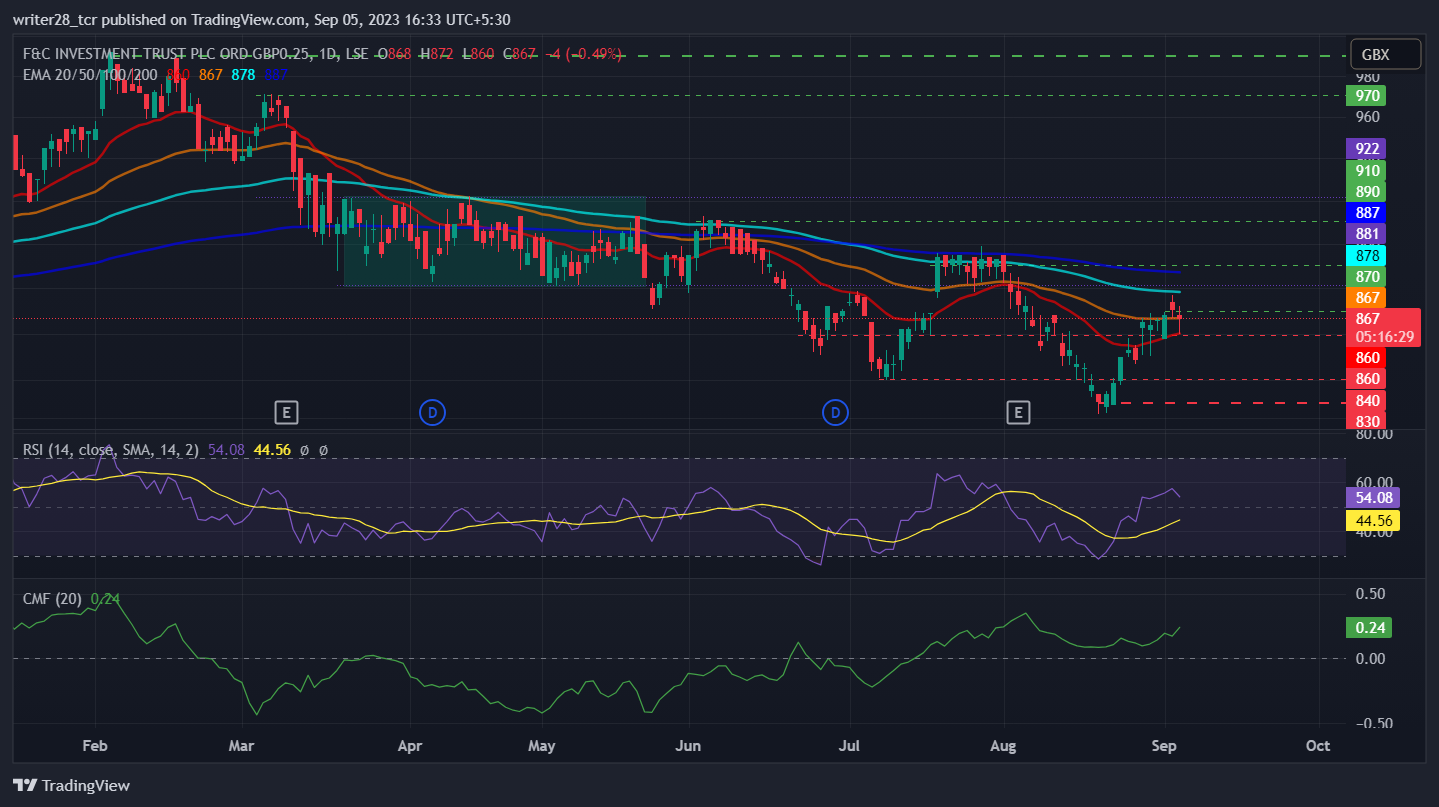
The stock price is hovering below the 50, 100, and 200-day EMAs, indicating the downtrend in the price action, while it has shown rejection of the 20 and 50-day EMAs due to prominent performance in the present week.
Chaikin money flow (CMF) score has been trading above the 0 mark since 14 July 2023, indicating a solid confluence of bulls, which elevates the price action. CMF stands at 0.24, suggesting vigorous strength in the FCIT stock price.
The RSI (relative strength index) has been above 50 since 26 August 2023. The RSI is at 54.08 during the intraday trading session. This reflects that the price is in an overbought zone.
Conclusion
F&C Investment Trust PLC stock has experienced a significant fall throughout the year, with the stock price having gone down by approximately 16%. However, the stock is now in an uptrend phase.
Technical Levels
Major support: £826 and £840
Major resistance: £971 and £992
Disclaimer
The views and opinions stated by the author, or any people named in this article, are for informational purposes only. They do not establish financial, investment, or other advice. Investing in or trading crypto assets comes with a risk of financial loss.




