
 Pearl
Pearl Bitcoin
 NEAR Protocol
 Starknet
 Solana
 Quant
Quant Ondo
Ondo
- A steep decline in the IAG stock price is still continuing but it can recover with good fundamentals!
- Iamgold Corporation has 5.065K employees and it was founded in 1990.
The technicals of the IAG stock are weak but the fundamentals can be considered neutral. Expert analysts are neutral on the share based on the current situation of the market.
The current operating margin of the company is 0.59. It has a debt/equity ratio of 104.11%, which is a positive sign for the growth of the company. The current market cap of the IAG share is $1 Billion with 481.1 Million shares trading in the market. Also, the average volume of the share is 2.93 Million.
Iamgold Corporation has a price-to-earnings ratio of 21.90, following a current ratio of 2.35, which means that the company is capable enough to pay its debt. The gross profit margin of the company is 0.15 and the debt ratio of the company is 0.50.
IAG Performance Analysis
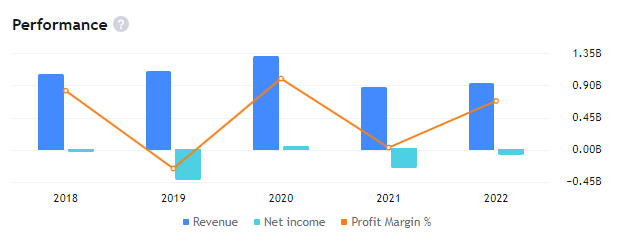
IAG made a revenue of $921.58M in the 2022 following a gross profit of 10% and EBITDA of 30%. In the last few years the revenue of the company has been uncertain and has incurred a loss of $67.32M as a net income in the year 2022. Currently, the company has a debt of $992.05M following a negative cash flow of $349.00M
IAG Holdings Technical Analysis
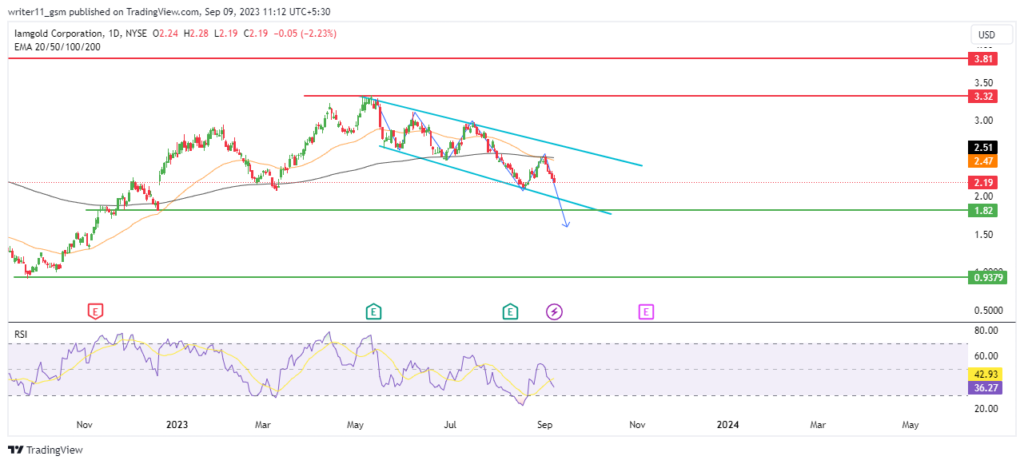
After showing a negative change of character in the charts. The price of the stock has been consistently declining from the higher levels and is making a lower low structure. This decline in price has led to the formation of the falling wedge pattern. The price is still making a bearish candlestick pattern, which indicates that the sellers are still active. They can take the price to further lower levels.
Due to the huge decline in IAG share price the 50-day and the 200-day EMA have led to the formation of a bearish cross on the charts. It indicates the beginning of a downtrend for a larger timeframe. Thus, the EMA is indicating a bearish signal on the charts.
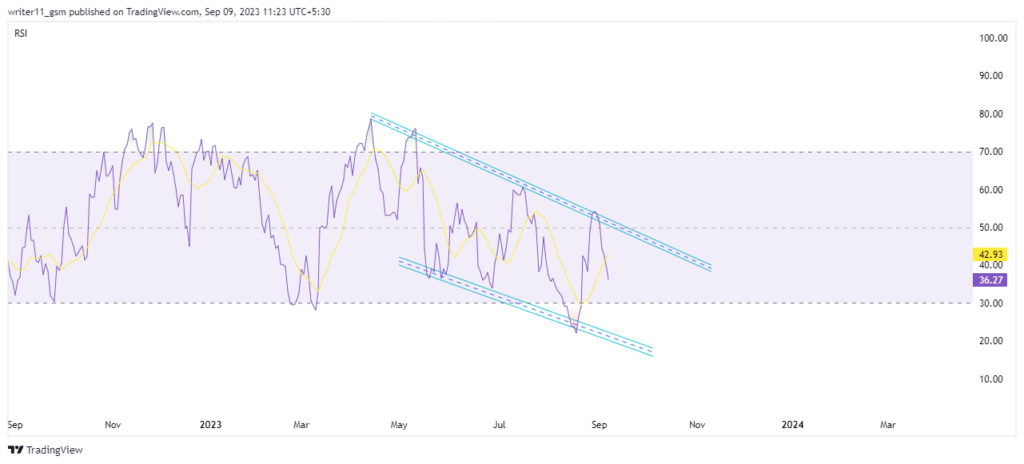
Due to a steeper decline in price, the RSI has also formed a falling wedge pattern and the value of the RSI is following the declining channel. It indicates that the RSI is bearish until it breaks above the falling wedge pattern and hit the overbought zone levels.
Price Targets for IAG Stock
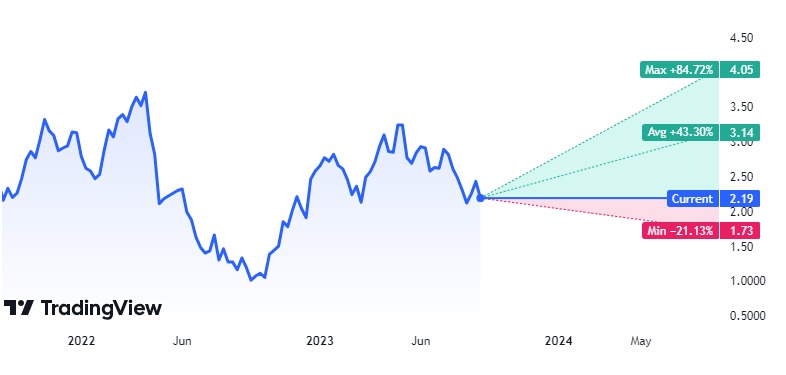
Looking at the experts analysis, we can say that the stock still has a potential to advance by 84% at max. It can decline upto -21% and the average value of the stock is 43.30% above the current levels.
Conclusion
Due to consistent decline in price the market has formed a falling wedge pattern. The stock price is still trading inside the same pattern, forming a bearish candlestick patterns. The EMA and the RSI are also bearish based upon the current scenario of the charts. Therefore, the price may continue to decline to lower levels unless it breaks above the falling wedge pattern following a breakout in RSI as well.
Technical Levels
- The support levels for IAG Stock are – $0.93 and $1.80
- The resistance levels for IAG stock are – $3.30 and $3.80
Disclaimer
The information provided in this article, including the views and opinions expressed by the author or any individuals mentioned, is intended for informational purposes only. It is important to note that the article does not provide financial or investment advice. Investing or trading in cryptocurrency assets carries inherent risks and can result in financial loss.




