
 Quantus
 Injective
 NEAR Protocol
 Sei
Sei Derive
 Bitcoin
 Zcash
Zcash
- The stock price of Riot Platforms (NASDAQ; RIOT) has given a return of -24.7% in one year.
- The quarterly profit margin percentage of the RIOT is decreasing.
- The stock is trading at $10.68, declining 2.73% in today’s market session.
Riot Platforms Inc. operates primarily in Bitcoin mining and focuses on blockchain technology. Looking at the weekly chart, Riot Platforms (NASDAQ: RIOT) stock is clearly following a downtrend, consistently forming higher highs.
In February 2021, the stock made a high of $79.50, and immediately after this, the stock experienced a downfall. The price fell by almost 95% of its value in the upcoming one and half years. This was one of the major falls faced by the stock.
Currently, the stock price of Riot Platforms is trading within a descending triangle pattern, indicating a negative trajectory. It’s facing a notable resistance level at $19.45, and the price reversed after reaching this resistance, suggesting a potential fall in the days ahead.
Riot Platforms does not offer dividends to shareholders, which might deter potential buyers. Additionally, the stock showed a -20% return in the previous month.
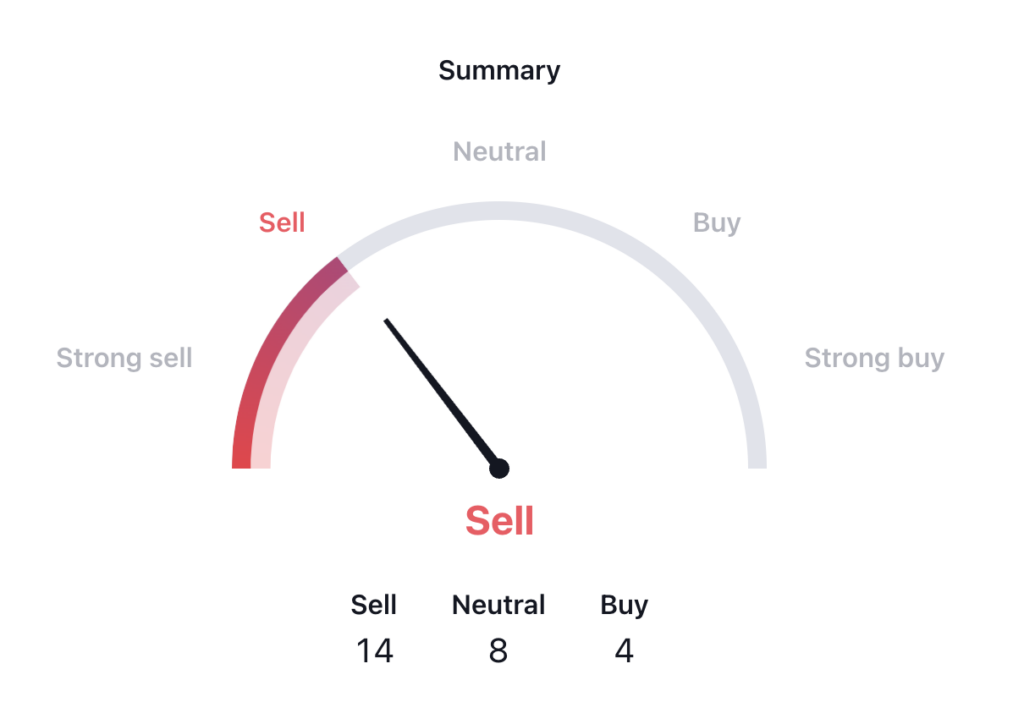
Analysing technical indicators, a majority of the top 26 indicators signalling a sell, indicating a seller-dominated market. Moreover, the quarterly profit margin percentage from the income statement portrays a declining trend, reflecting the stock’s underperformance.
Riot Platforms (RIOT) Stock Price
ss by writer50_tcr on TradingView.com
Riot Platform (RIOT) is presently trading below both the 50-day and 100-day Exponential Moving Average (EMA) levels weekly, signifying a continuous downtrend in the price.
The Moving Average Convergence Divergence (MACD) indicator for Riot Platform (RIOT) provides a weak signal. The MACD line remains below the signal line, and a red histogram indicates a negative movement for the stock.
Riot Platform (RIOT) also exhibits a bearish reading on the Relative Strength Index (RSI), with the RSI still positioned below the 50 level. Additionally, the RSI’s placement below the Simple Moving Average (SMA) line further reinforces the negative outlook for the stock.
Conclusion
In conclusion, as per the analysis, the Riot platform is moving in a downtrend momentum. The price is forming a weak structure and given a return of -20% in the previous month. The indicators are negative on stock and the price is likely to decline in the future if it breaks below the support level.
Technical Levels
- Support Level – $10.85
- Resistance Level – $25.5
Disclaimer
The views and opinions of the author or anyone named in this article, are for informational purposes only. They do not offer financial, investment, or other advice. Investing or trading crypto assets involves the risk of financial loss.




