
 Dacity Coin
 NEAR Protocol
 Pearl
Pearl Pudgy Penguins
 Injective
 Aerodrome Finance
 Pump.fun
- Carvana stock is facing resistance at higher levels.
- CVNA stock currently has an implied volatility of 18.28%.
Carvana Co. (NYSE: CVNA) is an online used car retailer headquartered in Tempe, Arizona. It is notable for its innovative approach to selling used cars, including multi-story car vending machines. Founded in 2012 by its co-founders Ryan Keeton and Ben Houston, Carvana has quickly risen to prominence in the automotive industry. Impressively, it has earned a spot on the Fortune 500 list, making it one of the youngest companies to achieve this distinction. Carvana is recognized as the second-largest online retailer of used cars in the United States.
The current market cap of the company is $9.889 Billion and the basic EPS of the company is in negative figures of -$12.34, which clearly means that the company is incurring losses on each share. The company has 106.44M shares currently floating in the market available for trading.
The average volume of shares is 20.55 Million. The net cash for the company has declined by -43.4% year-on-year resulting in $677.00 Million for Q2 2023 and following the same the long-term debt has declined by 3.3%. The current debt/equity ratio of the company is highly negative with a ratio of -1200.57%, which is not good for the future performance of the company.
Carvana Co. Performance Analysis
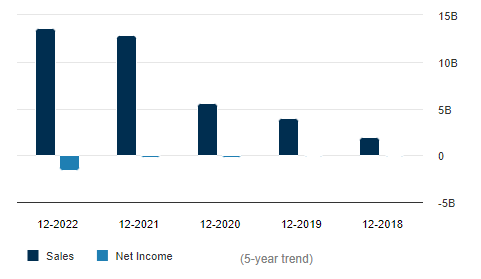
The company made total sales of 13.60 Million in the year ending December 2022, resulting in a net loss of $1.58 Million. The total assets for the company has increased to $8.698 Million, resulting in an increase of +23.99% as compared to the year 2021. Additionally, the company currently has a negative operating cash flow of $1.32 Million and the net cash flow is -$8,000.
CVNA Technical Analysis
a by writer11_gsm on TradingView.com
CVNA stock is trading in an uptrend, making higher highs and it is currently facing resistance at the higher levels. If it breaks below the dynamic rising trendline, this will result in a double top pattern which will lead to a change in the trend towards the negative direction.
Following the uptrend, the price has led to the formation of the golden cross of the 50-day and the 200-day EMAs and the price is currently trading above both the EMAs, which is a positive signal.
The RSI for the stock is at a level of 59.44 following a decline from the overbought zone, but since it is currently above the 50-level, this makes it bullish in the current scenario.
Technical Overview of CVNA Stock
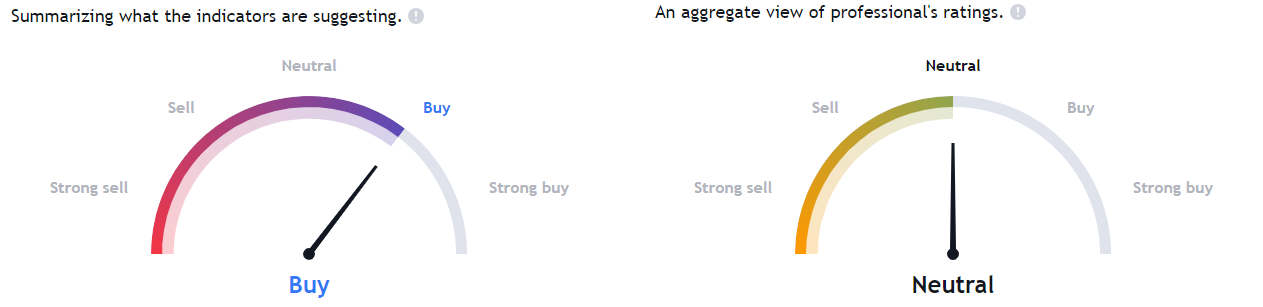
Following the last few weeks’ price action, multiple indicators like trend seeker, RSI, and others are giving a buy signal which is making the technical chart bullish. However, the expert analysts are neutral on the stock based upon the fundamentals.
Conclusion
The current outlook for CVNA stock is characterized by a bullish trend, marked by an uptrend. The RSI is indicating a bullish sentiment, and there’s a golden cross forming with the EMAs. However, it’s worth noting that the stock is encountering resistance at higher price levels and facing rejection from a critical swing level.
If the price manages to break below the previous swing low, it could potentially signal a change in the trend, leading to a downtrend and potentially forming a double top pattern. As a result, the current market conditions are uncertain, and the stock’s future direction will depend on whether it breaks out in either direction.
Technical Levels
- Support levels for the CVNA share are – $29.00 and $36.50
- Resistance levels for the CVNA share are – $ 57.00 and $68.00
Disclaimer
The information provided in this article, including the views and opinions expressed by the author or any individuals mentioned, is intended for informational purposes only. It is important to note that the article does not provide financial or investment advice. Investing or trading in cryptocurrency assets carries inherent risks and can result in financial loss.




