
 streamoors
 IGNITION
 Injective
 Quantus
 Pearl
Pearl Aerodrome Finance
 NEAR Protocol
- The DAVA price has surged by 10.86% since the last trading session.
- The price is currently trading at $56.54.
Endava Plc (NYSE: DAVA) was founded by John Edward Cotterell in 2000. The company deals in the provision of technology services. The firm focuses on finance, insurance, telecommunications, media, and retail companies.
Endava Plc (DAVA) Stock: Financial Analysis
DAVA has recently reported growth in its revenue in the 2023 revenue report. The firm’s revenue increased to $955.89 Million in 2023 from $870.24 Million in 2022, with a growth rate of 9.84%.
The company’s gross profit increased in the recent annual report, where it increased by 12.21% compared to the prior year.
The company’s net income surged by 2.55% in the 2023 annual report. The firm reported an increase in its net income from $110.44 Million in 2022 to $113.26 Million.
The company has maintained its return on investment (ROI) above 10% since 2021.
The company’s net debt-to-equity ratio is consistently below 1%. This shows the company’s healthy performance due to its lower debts. It can also be considered a progressive growth in its financial statement in the upcoming years.
Overall, the company’s 2023 report has been healthy, with constant growth in each segment.
Endava Plc (DAVA) Stock: Technical Analysis
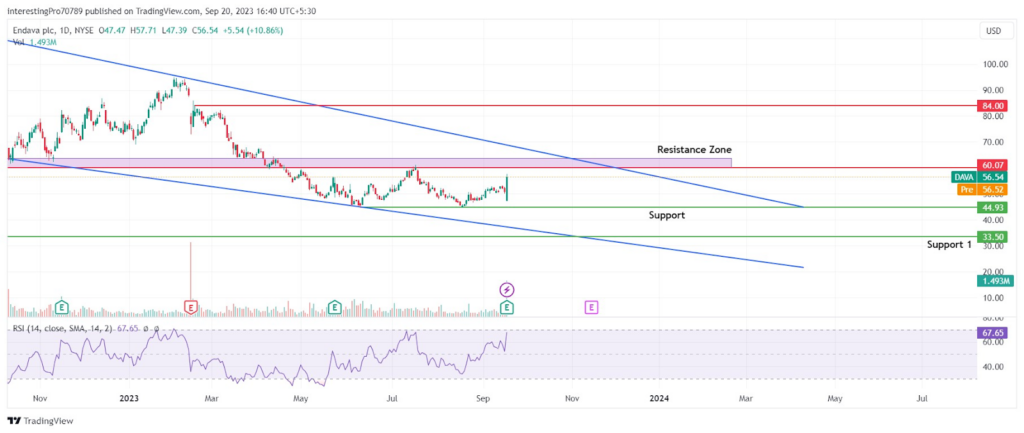
The DAVA stock price is currently trading at $56.54, with a market capitalization of $3.209 Billion and an average volume of 394.365K.
The stock price has been in a continuous downtrend since mid-August 2023, with higher-low and lower-low formations. The price has broken below every major support that has come in its way. Recently, the price has also broken below the support of $60.07 and is trading between $60.07 and $44.93.
If we monitor the price over a longer time period, we can see a falling wedge pattern forming since the price started to fall in mid-August.
The DAVA price is trading between 50 and 200 EMA, where 20 EMA is the yellow line and 200 EMA is the red line. This EMA line indicates the indecisive behavior of the price as it is influenced by sellers as well as buyers.
The relative strength index is at 67.65, and the RSI line is sloping in the upward direction. This indicates the price is in bullish sentiment but the RSI line is heading towards overbought territory, which could lead to a short-term fall in price
Price Prediction On The Situation
Currently, the price is unpredictable at the time of writing. $60.07 (resistance) and $44.93 (support) are acting as important levels. If the price breaks above or gives a breakout of the $60.07 resistance, then the price may rise to its next resistance at $84.00.
However, for the price to continue its bearish trend, it must give up the breakdown of $44.93 support before it can reach its historical support at $33.50.
Conclusion
The overall chart of Endava Plc (DAVA) is bearish. The price has been in a downtrend since mid-August and is currently trading in a range of $60.07 (resistance) to $44.93 (support). The breakout or breakdown of this range will determine the future trend of the price. If the price breaks above or gives a breakout of the $60.07 resistance, then the price may rise to its next resistance at $84.00.
However, for the price to continue its bearish trend, it must give up the breakdown of $44.93 support before it can reach its historical support at $33.50.
Technical levels
Resistance Levels: $60.07 and $84.00
Support Levels: $44.93 and $35.50
Disclaimer
The views and opinions stated by the author or any other person named in this article are for informational purposes only. They do not provide financial, investment, or other advice. Investing in or trading crypto assets comes with a risk of financial loss.



