
 Quack AI
 Pudgy Penguins
 Starknet
 Pearl
Pearl Sui
Sui Celestia
 Quantus
- The Icon Coin price is trading near its 52-week low level.
- The ICX coin price has surged over 6.66% in a week and 4.45% in a month.
- ICX coin is forming a base near its support level of 2020.
Current Market Capital of ICX Coin – $171.914 Million
Current Market Price of ICX coin – $ 0.1774
ICX Coin Overview
The Icon coin price is currently trading up by $0.0048 with a rise of 2.78% on 22 September. The price is forming a Bullish Marubozu candle as the open and low of the price are the same. This Coin’s price has been able to close above the range it was traded, where the price was facing rejection near the price of $0.1772.
Like most of the coins, the ICX token is trading inside the range of 17 August’s candle. The price has declined by over 20% intraday but closed the day with a decline of just 10%. Since then, the price of the ICX token has been trading inside the range of the same candle. The Coin has formed a double bottom pattern at the $0.1507 level.
The price of ICX coin has surged by 6.66% in a week and 4.45% in a month, indicating that
the buyers are showing some strength now. Although the price has declined by over 23.3% from the upper level, the overall trend is down, and sellers control the price.
Technical Analysis of ICON (ICX)
The price has formed a descending triangle pattern, trading very close to its resistance level. The price has taken robust support from the level of $0.1507, where it formed a double bottom pattern, the price has formed several resistance points near $0.2600 and $0.3260.
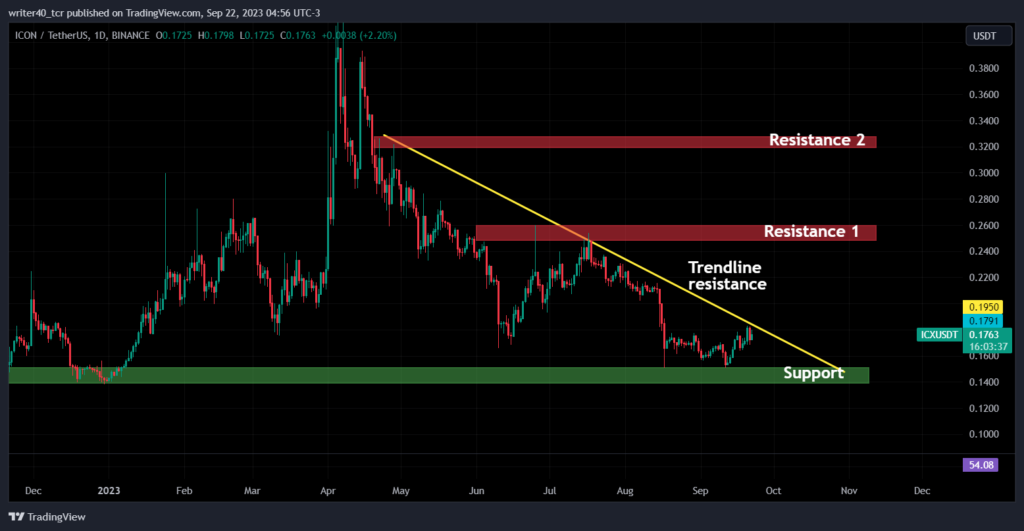
The price has been tested on the resistance level of $0.2600 twice. The resistance level is shown as the resistance 1 on the chart. The other resistance level, drawn as resistance 2, is near the $0.3260 level. This resistance was tested only tested once. The price can face some rejection from the downward-sloping trendline marked in yellow on the chart.
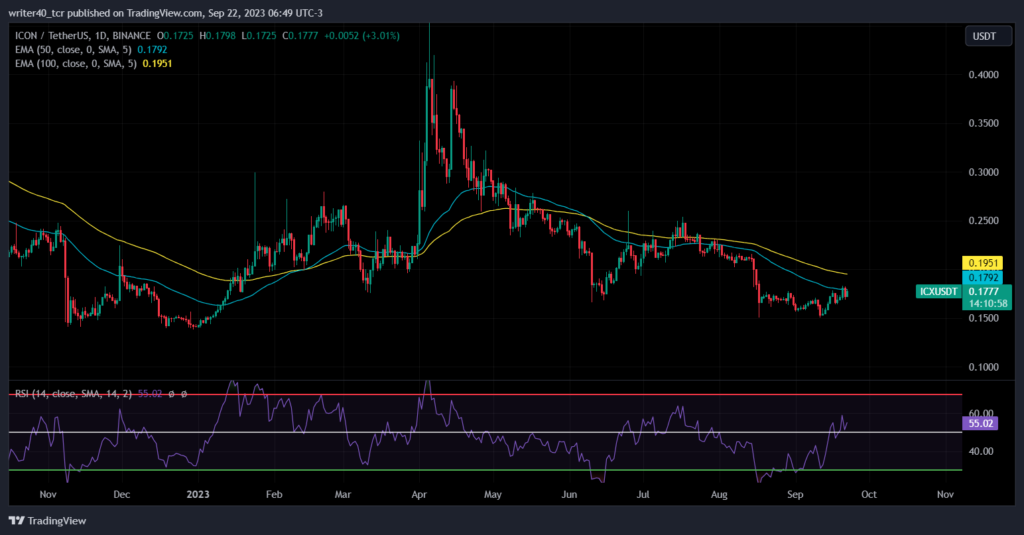
The ICX coin’s price trades below the important EMAs of 50 and 100. The EMAs are present at $0.1792 and $0.1951 respectively. The slope of the EMAs is down, which is a sign of bearishness in the coin. The RSI is currently placed comfortably above the 50 level, showing that the bull’s momentum has shifted.
Conclusion
The price has formed a base at the $0.1507 level, and the price has surged well from the lower levels. The RSI shows that the momentum has shifted towards buyers, so the price can try to move towards the level of $0.2100. If the price starts declining from this level and breaks the support level of $0.1507, it can try to achieve the $0.1391 level.
Technical Level
Resistance – $0.2600 and $0.3260
Support – $0.1507 and $0.1391
Disclaimer
The views and opinions stated by the author, or any people named in this article, are for informational purposes only. They do not establish financial, investment, or other advice. Investing in or trading crypto assets comes with a risk of financial loss.




