
 Dacity Coin
 Pearl
Pearl Bitcoin
 Injective
 Pudgy Penguins
 Quantus
 Starknet
- Billionaire Elon Musk Faces $258 Billion lawsuit over dogecoin endorsement.
- It is currently trading at $0.062 with an intraday rise of 0.03%.
- The token is down from its all-time high by 91.52%.
The DOGE coin Investor Sues Elon Musk and Seeks Action And Compensation :
Keith Johnson, a Dogecoin investor who claims he suffered losses, is filing an allegation of a $258 billion lawsuit in a New York court. He claims that Dogecoin, which started as a meme coin, operated as a “Dogecoin Crypto Pyramid Scheme” and defrauded him. Johnson seeks justice for the fellow investors who have suffered losses in Dogecoin since 2019.
Investor Demand for Compensation and Damages :
Keith Johnson demands that Elon Musk should compensate investors approximately $86 billion, the estimated losses suffered since Elon Musk’s promotion of Dogecoin began. Also, He is asking double of that amount, a total of $172 billion, in damages.
- SOURCE : NEWS BY CRYPTOSHEADLINES.
The value of the dogecoin has recorded a loss of almost 16% in the last 6 months. The token after the negative news also fell by almost 6 cents on thursday last week, the token has been falling significantly from its last high of $0.10 recorded on 3rd april this year.
The token is trading with a rise in the volume by 12.3% in the last 24 hours.
The token recorded its all-time high on 8th May 2021 where a single token was valued at $0.7376.
- The total circulating supply of the coin is currently circulating in the market which is about 141.09B DOGE.
- The 24-hour trading volume of the token is $214.39M.
- It has a present market cap of $8.76B.
SENTIMENT ANALYSIS :
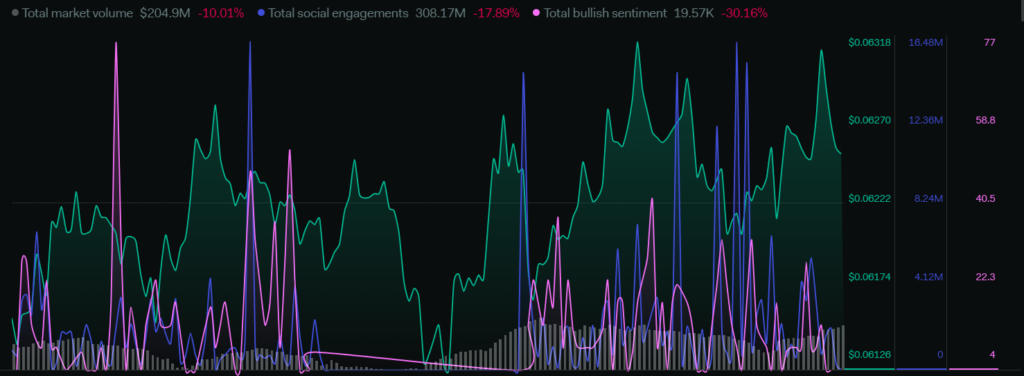
The total market volume of the token has declined by 10% in a week. The total social engagements of the token has fallen by 17.89%, the total bullish sentiments of the token decreased by 30.10%. The negative impact of the news in last 1 week took all the sentiments towards a negative side and the price became bearish.
TECHNICAL ANALYSIS :
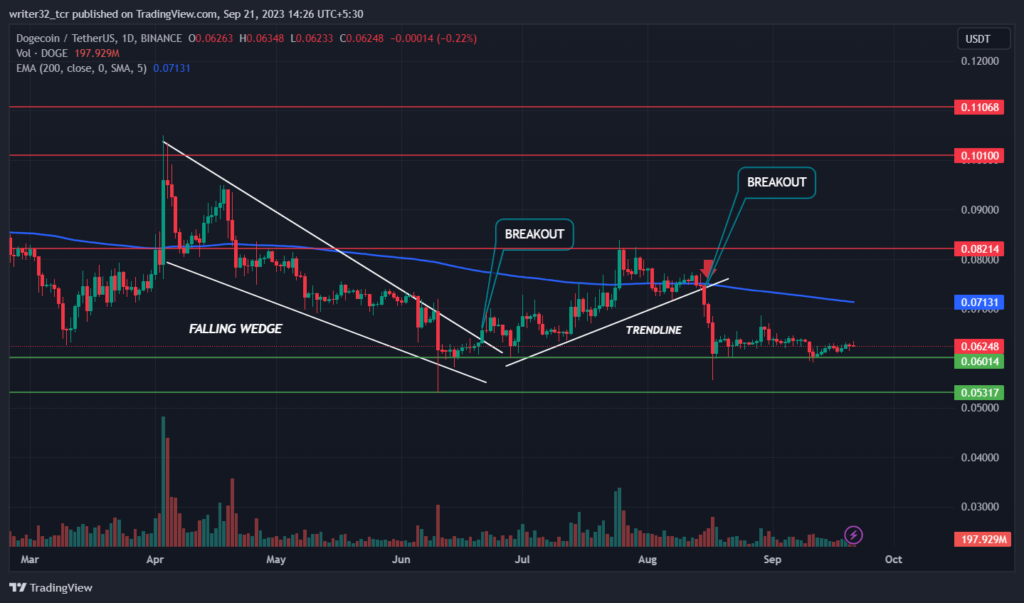
As we can see in the chart, The price after reaching its high of the year on $0.10 started a downtrend and also created a falling wedge pattern from where the price almost came down by 95%. The price also breakout from the top of the falling wedge and the price became bullish till $0.082 resistance. From the resistance the price got rejected and again got declined and it currently took support from $0.060 and is presently trading at $0.062.
If the price breaks the range of sideways movement from $0.062 to $0.065 then the price will positively move upwards. The price breaks below the $0.060 range then we can see the next support level at $0.053.
The long term scenario for the price of the DOGE remains bullish.
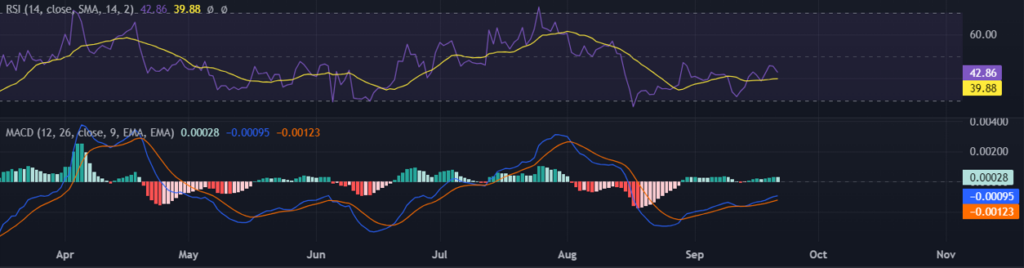
Relative Strength Index ( RSI )
The line of RSI is currently moving at 42.86 points and the SMA 14 line is moving at 39.88 points. The RSI is below the neutral level 50 and currently under a bearish movement and if the price goes below the RSI 30 we can see further downfall. If the RSI crosses above the neutral level 50 then a short upward movement can be seen.
Moving Average Convergence/Divergence ( MACD )
In MACD, The fast blue line moving average is above the red slow line moving average and the histogram is showing a low increase in the volume. Here, The price can rise but a low upward will be seen with this amount of volume. The volume has keep on increasing with the RSI to start a bullish move.
DOGE LIVE CHART :
CONCLUSION :
The token is currently under a bearish scenario due to the negative sentiments in the market of the token. The price can be seen rising when the community of the DOGE investors will become active and the trading volume will increase, until then the price might be bearish.
TECHNICAL LEVELS :
SUPPORT : $0.060 AND $0.053
RESISTANCE : $0.082, $0.10 AND $0.11
Disclaimer
The views and opinions stated by the author, or any people named in this article, are for informational purposes only and do not establish financial, investment, or other advice. Investing in or trading crypto assets comes with a risk of financial loss.




