
 Quack AI
 Pearl
Pearl Solana
 NEAR Protocol
 Canton
 XRP
XRP Derive
- The LUNA token is currently trading at $0.395 with a surge of 2.09% in the last 24 hours.
- The token price is down by 97.76% from its all-time high.
The Terra Coin is currently trading with a surge in trading volume by 202% in the last 24 hours. It recorded its all-time high on 28th May 2022, when a single LUNA token was priced at $19.54.
- It has a current circulating supply of 381.312M LUNA coins, which is only 37.96% of its total supply.
- The present market capitalization of the token is $151.12 Million.
- The 24-hour volume of the token is $40.22 Million.
SENTIMENT ANALYSIS (1 WEEK):
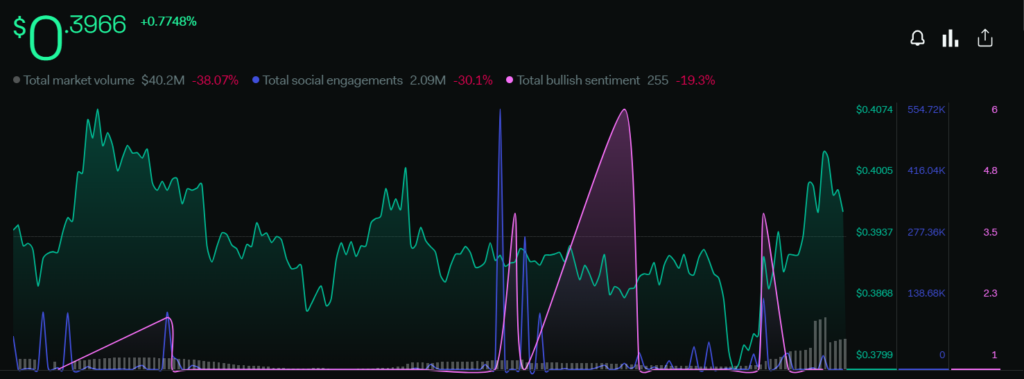
The price of the token has increased by 0.77% and the total volume of the token has declined by 38.07% in the last 1 week. The total social engagements recorded a fall of 30.1% and the total bullish sentiments decreased by 10.3%. This token’s weekly sentiments indicate a negative side of the price action.
DAILY SENTIMENTS (1 DAY)

The price of the token has increased by 2.53% and the volume of the token has recorded a rise of 92.52% in the last 1 day. The social engagements surged by 45.24% and the total bullish sentiments declined by 17.98%. Daily sentiments of the token are indicating an upward movement in the price as the volume has started increasing.
TECHNICAL ANALYSIS (DAILY- 1D):
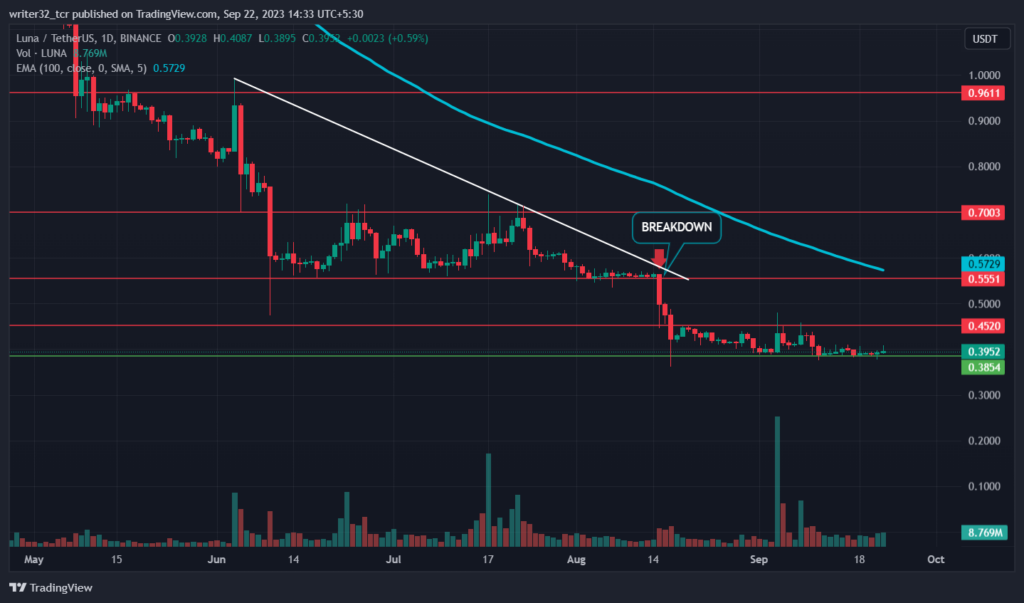
As we can see in the chart, the price was rejected from the resistance of $0.96 and started a downtrend. After the downfall, the price started to trade sideways between the level of $0.55 and $0.7003. It was also trading below the bearish trendline from where it was getting rejected. In the 3rd rejection, the price broke down from the support level of $0.55 and fell to the level of $0.38. The $0.55 level is acting as a resistance.
LUNA coin’s price is currently trading at the support level of $0.39 from where it is likely to take support and move upward. It might happen because the trading volume of the token has started to increase. The price has to break the last lower low and then the resistance level of $0.55 and $0.70 to confirm the bullish move.
The price has to break major resistance of $0.70 and $0.96 and get above the 100-day EMA to reach the $1 level this year. Bullish investors have to dominate bearish investors to reach the target level.
Relative Strength Index (RSI)
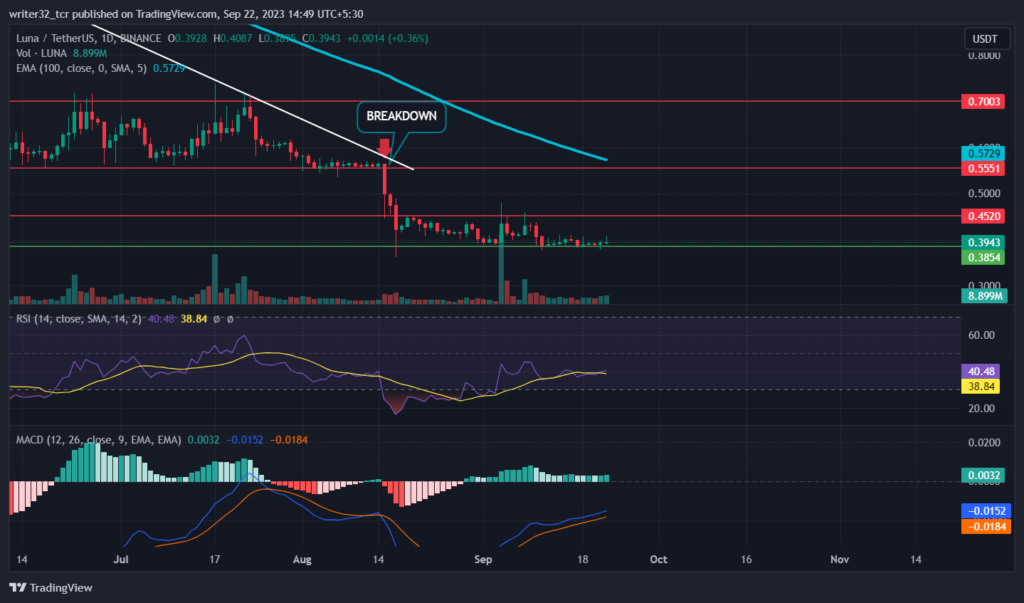
The line of RSI is currently moving at 40.48 points and the SMA 14 line is moving at 38.84 points. The RSI is presently below the neutral level of 50. It is showing a bearish move as the current RSI is below the average levels.
Moving Average Convergence/Divergence (MACD)
In MACD, The fast blue line moving average is above the red slow line moving average. The volume in the histogram is the same in the last few days. If the volume increases, we can see a surge in the price levels. Suppose the volume stays the same or decreases, we can see a bearish move or a sideways move between $0.39 to $0.45.
LUNA LIVE CHART :
CONCLUSION
If the price breaks the last lower low and the resistance levels of $0.45 and $0.55 with an immense amount of volume, we can see a bullish movement in the price action for the medium-short-term time frame. The price will cross above the 100-day EMA after getting above the $0.55 resistance.
Also, If the price breaks below the $0.39 resistance and the volume starts to fall, we can see a further downfall in the prices of the token.
TECHNICAL LEVELS:
SUPPORT: $0.38
RESISTANCE: $0.45, $0.55, $0.70 AND $0.96
Disclaimer
The views and opinions stated by the author, or any people named in this article, are for informational purposes only and do not establish financial, investment, or other advice. Investing in or trading crypto assets comes with a risk of financial loss.




