
 Quantus
 Injective
 NEAR Protocol
 Sei
Sei Derive
 Bitcoin
 Zcash
Zcash
- Merit Circle shares its DAO progress update in September 2023.
- It is currently trading at $0.364 with an intraday rise of 2.3%.
- The MC token is down from it’s all-time high by 99.18%.
MERIT CIRCLE launched its own gaming subnet named ‘BEAM’. The BEAM network is now available for the first wave of game developers. The token is currently trading with a fall in trading volume of 10.94% in the last 24 hours. The token marked its all-time high on 16th Nov 2021, where a single MC token was priced at $45.24.
- The present market cap of the token is $156.23 Million.
- It has a current circulating supply of 430.792 Million MC coins which is 64.32% of its total supply.
- The 24-hour trading volume of the token is $21.54 Million.
SENTIMENT ANALYSIS (1 DAY):
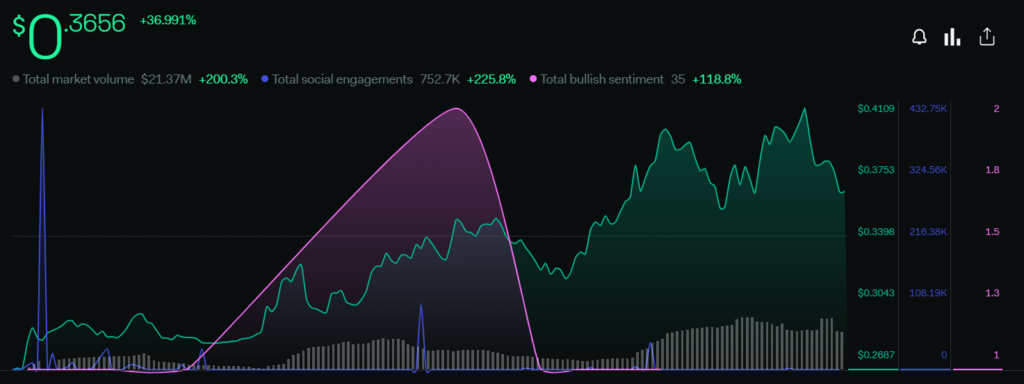
The value of the token has increased by 36.991% and the total market volume of the token has surged by 200.3%. The ‘BEAM’ network launch news played a positive role for the MC coin. This token’s price and volume increased.
The total social engagements have recorded a rise of 225.8% as the social community also looks active. The total bullish sentiments went up by 118.8%, which shows that the token is under a bullish move from last week.
TECHNICAL ANALYSIS (DAILY):
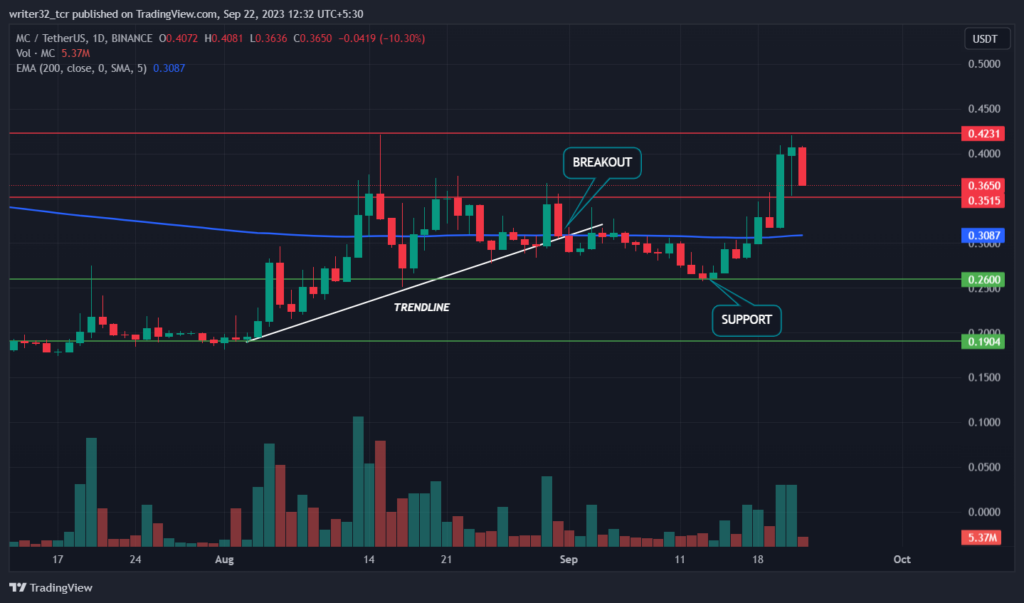
As we can see the price was moving on a bullish trendline from where the price was making higher highs and it was getting rejections from the $0.365 resistance level. The token price tried to break above the resistance 3 times, but it did not succeed. In the third rejection from $0.365, the price broke below the trendline and went down from the 200-day EMA.
The “BEAM” network news came on 15th Sep 2023, which played a positive role in the price. On the same day price took support from the level of $0.26 and the trading volume started to rise. Token’s price went up by 60%. The price touched the resistance level of $0.42 and was rejected.
The price is currently making a red bearish candle from where it can start falling, the price can also take support from $0.365 and continue upward movement. If it breaks the $0.365 level, the next support will be the 200-day EMA. Suppose the price broke that also, it may fall to the $0.26 level.
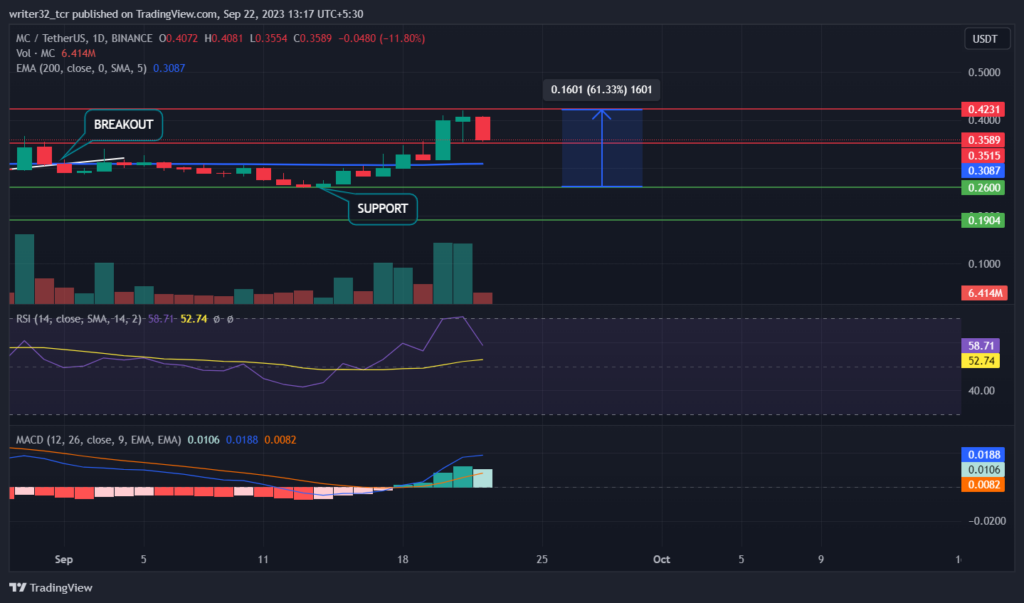
Relative Strength Index (RSI)
The RSI line is currently moving at 58.71 points and the SMA 14 line is moving at 52.74 points, the RSI is presently above the neutral level of 50. The RSI started to reject once it reached the 70-point level of the overbought zone. The price also got rejected from the resistance and made a red bearish candle.
Moving Average Convergence/Divergence (MACD)
In MACD, The fast blue line moving average is above the red slow line moving average and also moving above the average level of 0. The histogram shows a surge in the volume, but today the volume seems to be low as compared to previous days. It shows a bearish move in the price action. If the volume in the histogram starts to go down in the upcoming days, we can see negativity in the prices.
MC LIVE CHART :
CONCLUSION
The price is currently getting rejected from the resistance level of $0.42 from where the price got rejected and made a red bearish candle. It can take support from the $0.36 level, which also acts as a resistance to the token price. MC’s price will continue the upward move if that happens.
If the price breaks the support of $0.36, the next support will be the 200-day EMA. Suppose it goes below the 200-day EMA, we can see the fall to the level of $0.26.
TECHNICAL LEVELS:
SUPPORT: $0.19 AND $0.26
RESISTANCE: $0.36 AND $0.42
Disclaimer
The views and opinions stated by the author, or any people named in this article, are for informational purposes only and do not establish financial, investment, or other advice. Investing in or trading crypto assets comes with a risk of financial loss.




