
 Minter
 Quack AI
 Starknet
 NEAR Protocol
 Sui
Sui Hyperliquid
 Bittensor
- The is stock price currently running down by 2.89% since the last trading session.
- This price reflects the bearish sentiment over the price at the press time.
NVIDIA Corp. (NYSE: NVDA) was established in April 1993 by Jen Hsun Huang, Chris A. Malachowsky, and Curtis R. Priem. It deals in the manufacturing and designing of computer graphics processors, chipsets, and related multimedia software.
The NVDA stock price is trading at $410.17 with a market capitalization of $1.013 Trillion. The company stock has been trading with a 10-day trading volume of 42.636 Million.
NVIDIA Corp. (NVDA) Stock: Technical Analysis
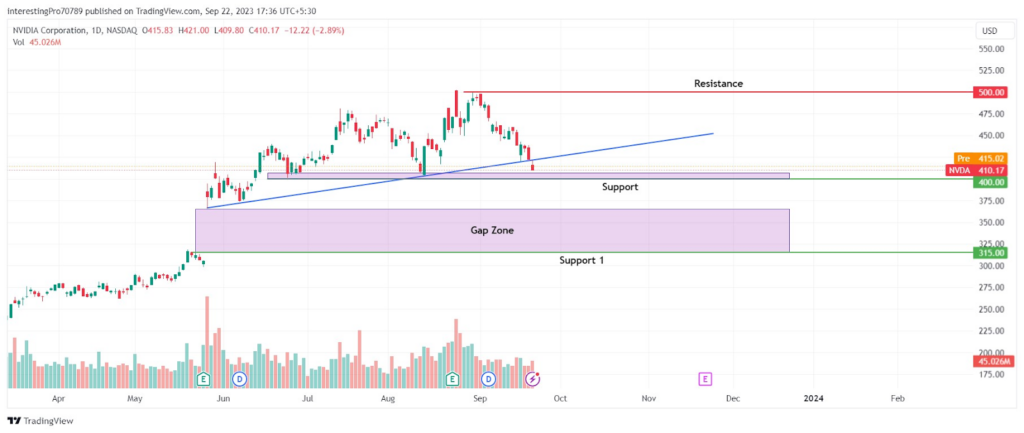
If we look at the 1-day timeframe, the NVDA stock price has left a gap in the chart and was trading above the gap zone. The price indicated a bullish rally and created its all-time high of $502.66. After that, it has started falling.
The price has been falling for 12 days. The price is currently giving the breakout of the trendline after forming back-to-back strong bearish candles. It is reaching its $400 support zone. If the price breaks below the $400 support zone, it could also fill the gap as per price action and fall to the $315 level.
The NVDA stock price can be in bullish sentiment if it sustains above the $400 support. It may later rise to the $500 level.
Technical Indicator About the Trend
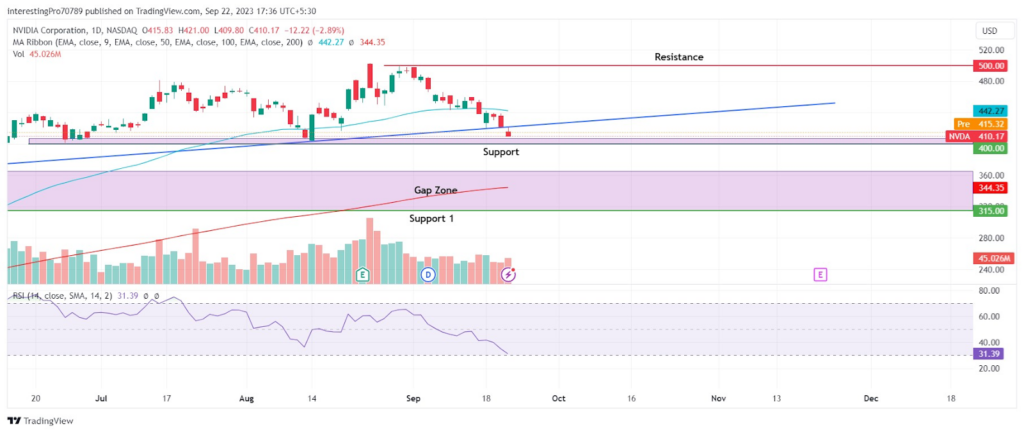
The NVDA price started to fall after taking resistance from the 50-day EMA. It is currently trading between 50-day and 200-day EMAs while both the EMA lines are very far from each other. The price could be seen falling to take support from the 200 EMA line, which is trading in the gap zone area.
The relative strength index is at 31.39 and the RSI line slopes downwards towards the oversold territory. It indicates that the price is currently in bearish territory. However, if the RSI line trends like this at the downside, an over-sold situation will be created in the market. Due to this, the price could seen taking pull-back.
Nvidia Incorporation 2023 Fiscal Result
The company has generated a revenue of $27.0 billion, which is the same as the previous year. The firm’s gross margin is down by 8% compared to its previous year’s performance. The operating income declined by 55% with $4.2 billion from its 2022 Fiscal year performance. Diluted EPS has also been decreased to 1.74 with a decline of 55% compared to the 2022 report.
The overall company’s result has faced a decline and has affected its yearly performance, which resulted in a fall in its share price.
Conclusion
The chart of the Nvidia Incorporation (NVDA) stock is bearish at the press time. The chat has a gap left that is yet to be filled. NVDA stock’s price has given the breakdown of the trendline and is falling to its $400 support. If the price also breaks below the $400 support zone, it may fill the gap. The stock price can be in bullish sentiment if it sustains above the $400 support and then it may rise to the $500 level.
Technical levels
Resistance levels: $500.
Support levels: $400 and $315.
Disclaimer
The views and opinions stated by the author or any other person named in this article are for informational purposes only. They do not provide financial, investment, or other advice. Investing in or trading in the stock market comes with a risk of financial loss.




