
 Quantus
 Pearl
Pearl Quack AI
 Starknet
 NEAR Protocol
 Zcash
Zcash Aerodrome Finance
- HL stock’s price is consolidating in a range of $944 GBX and 723 GBX.
- HL stock’s price has surged by 5.61% in a week but declined by 3.40% in a year.
- Revenue has jumped by over 88% since 2017 and Net profit by over 53%.
Market capital of HL stock – 3.909 GBP
The current market price of HL stock – 825.0 GBX
Hargreaves Lansdown’s Stock Overview:
In the previous trading session on 22 September, the price jumped by 13.4 GBX with a rise of 1.65%. The price escalated by over 5.61% in a week and 8.70% in a month which signifies that the bulls have taken control of the price. Although the price has declined over 3% in a year which indicates that there is some selling pressure on the upper side.
The revenue of the company has grown from 389.40 Million GBP in 2017 to 735.10 Million GBP in 2023, a rise of over 88% in 6 years. The net income of the company has grown from 211.70 Million in 2017 to 323.80 million in 2023, a rise of over 53% in 6 years. Net margin is creating some pressure on net income.
The company has a surplus cash and cash equivalent over the financial obligation. Consequently, the net debt of the company is in a negative trajectory. It shows that the company can become debt-free if the management decides to do so. The company dividend yield is promising as the current dividend yield is at 5.09% which is actually a good number for dividend seekers.
Technical Analysis of Hargreaves Lansdown Stock
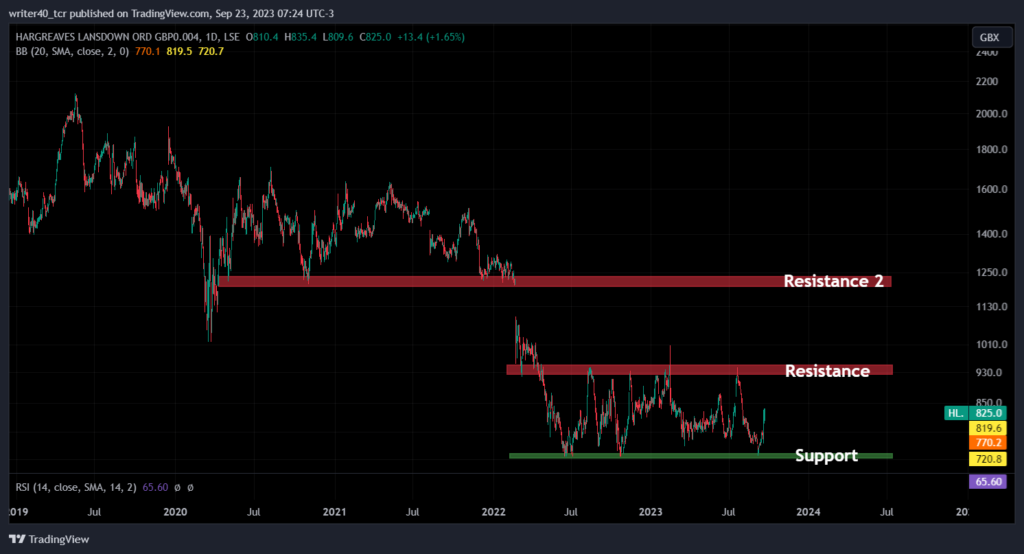
The HL’s stock price is consolidating between the range of 944.8 GBX and 723.6 GBX. HL’s stock price is currently trading in the middle of the zone. The price is looking strong as it has closed on a positive note for the 4th time in a row. A rise of 7.90% in just 4 trading sessions signifies that the bulls are in control of the price.
The price has tested the support level thrice and the resistance level for more than 5 times. The other resistance level is present near the 1200 GBX level. This level is also very important as the price has formed a huge gap of more than 100 GBX at this level on 22 February 2022.
Technical Indicators on the Current Price Movement
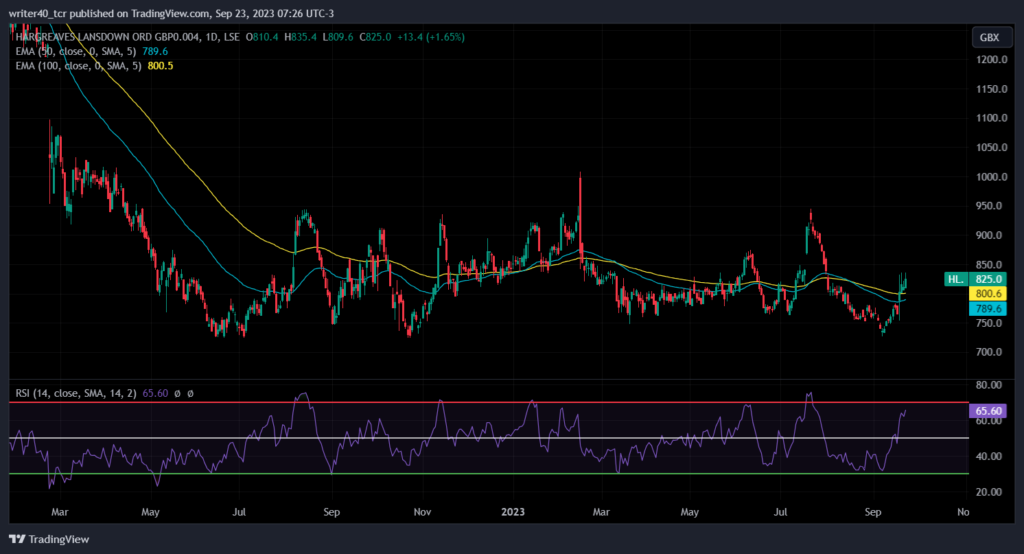
The Hargreaves Lansdown Stock price has started trading above the 50-day and 100-day Exponential Moving Averages. Both the EMAs are currently present at 796.6 and 800.6 levels. If we observe the chart the EMA’s curve has been flat for more than a year. This supports the above-mentioned statement that the price is in a consolidation phase.
Conclusion
The price of the stock has been consolidating for more than a year and the future expectations for the company’s finances are strong. This will bring stability in price and some confidence in the buyers. RSI is also favoring the bulls at the current level which can pull the price up in the near future.
Technical Levels-
Resistance – 944 GBX and 1200 GBX
Support – 723 GBX
Disclaimer
The views and opinions stated by the author, or any people named in this article, are for informational purposes only. They do not establish financial, investment, or other advice. Investing in or trading crypto assets comes with a risk of financial loss.




