
 Quack AI
 NEAR Protocol
 Quant
Quant Ondo
Ondo Zcash
Zcash Pearl
Pearl Sui
Sui
- The HIK price is currently trading at 2121 GBX.
- The price has started to show weakness after a strong bullish rally.
Hikma Pharmaceuticals Plc (LSE: HIK) is a British multinational pharma company. The firm deals in the manufacturing and marketing of branded and non-branded pharma generic products. Samih Taleb Darwazah founded the company in 1978.
Hikma Pharmaceuticals Plc (HIK) Stock: Technical Analysis
The HIK price is currently trading at $2127 with a market capitalization of 4.596 billion GBP. The company stock price trades with a 10-day average trading volume of 906.982K GBP. The company stock price has increased by 2.26% since the last trading session.
Technical Analysis on 1-Day Timeframe
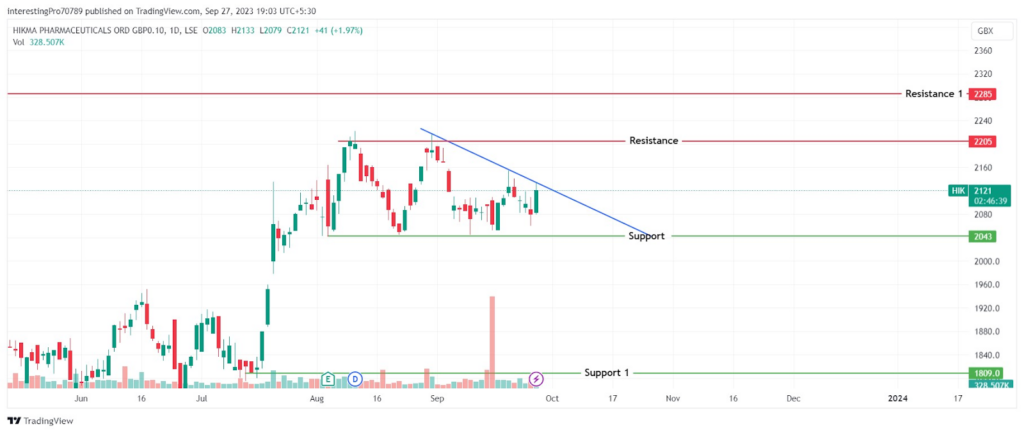
In the 1-day timeframe, the HIK stock price is trading in a wide range of 2205 GBX to 2043 GBX. The price has started to show weakness reaching 2205 GBX after a strong bullish rally because the sellers have started to show their dominance.
Firstly, the price was unable to close above the recent high and the sellers made the price fall from there. In the second try, the HIK stock price formed a Higher low which indicated that the sellers had shifted to the lower levels. This movement of the price has led to the formation of a trendline, which is acting as resistance and is stopping the price from moving up.
Currently, today’s trading candle in forming has surged by 2.21% since the morning trading session and is forming a strong bullish candle. If the price gives the breakout of the trendline, it can rise again to its immediate resistance at 2205 GBX.
However, if the sellers continued to dominate the price and forced it to break below the 2043 GBX support, the price could be seen falling to its next support at 1809 GBX.
Technical Indicators on the Current Trend
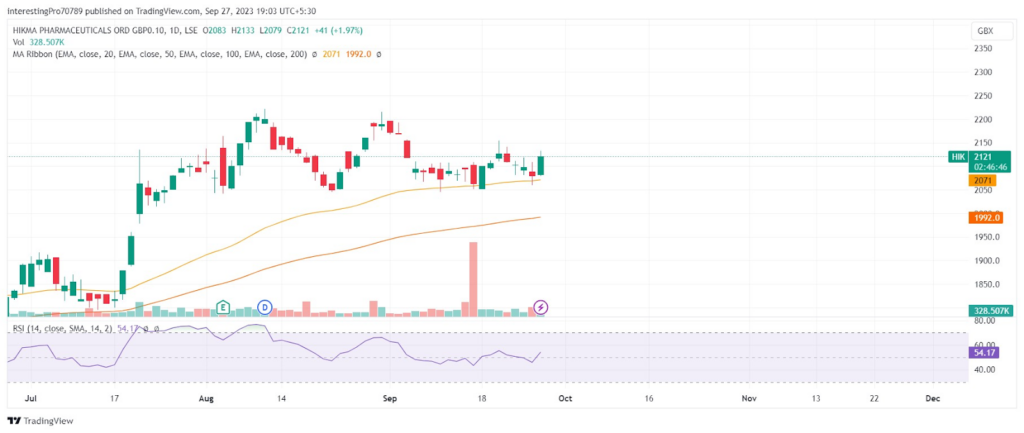
The HIK price is currently trading above the 50 and 200 EMAs indicating the buyers’ dominance and control over the price.
The relative strength index is at 54.51. The RSI line is neutral territory indicating the HIK price is being pressurized by buyers as well as sellers. However, the RSI line is trending in an upward direction, indicating the price is influenced more by buyers in comparison to sellers.
Conclusion
The HIK chart is reflecting bullish sentiment at the time of writing. However, the price has started to show weakness as it first failed to close above the 2205 GBX level and then created a higher low. It indicates that the sellers have started to influence the price but the buyers are still in control.
If the price breaks above the trendline from which it was continuously facing resistance, it may again rise to its 2205 GBX resistance. However, for the seller to shift the price in bearish sentiment, it must give the breakdown of the 2043 GBX support. Thus, it may fall to its 1809 GBX support.
Technical levels
Resistance Levels: 2205 GBX.
Support Levels: 2043 GBX and 1809 GBX.
Disclaimer
The views and opinions stated by the author or any other person named in this article are for informational purposes only. They do not provide financial, investment, or other advice. Investing in or trading comes with a risk of financial loss.




