
 Minter
 Quack AI
 Starknet
 NEAR Protocol
 Sui
Sui Hyperliquid
 Bittensor
- The Starbucks Corp stock price has shifted into a bearish trend for a short period of time.
- The bears have dominated the stock price with a share volume of 354.406 Million for the last three months.
Starbucks Corporation (NASDAQ: SBUX) is the world’s largest coffee house chain and roastery reserves. It provides its services in various locations in the world and was originally started in 1971. Its headquarters is located in Seattle, Washington.
Starbucks Corp (NASDAQ: SBUX): Technical Analysis
The SBUX stock price is currently trading at $92.00, representing a 0.80% decline in value during the intraday trading session. The stock has a trading volume of 6,086,633.
The previous day’s closing price for SBUX was $92.74. The current price-to-earnings (P/E) ratio for the stock is 28.05, indicating its valuation in relation to earnings.
The total market capitalization of SBUX stands at $105,376,800,000, reflecting its total market value as determined by its stock price and the number of outstanding shares.
Technical Analysis Of SBUX Stock
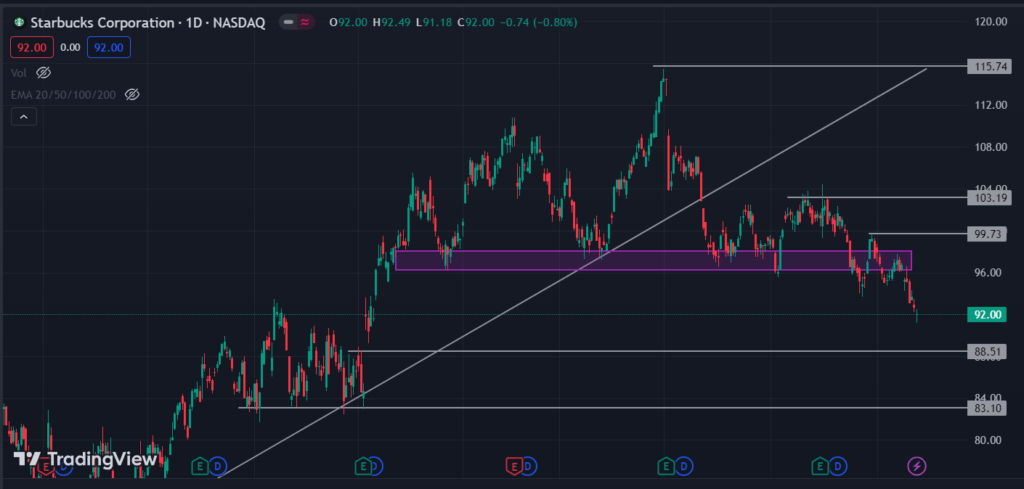
The stock price is in a downtrend at the $92.00 level, since it broke down the trendline at the $102.80 level. The price faced a strong resistance at $103.75, which played an important role in shifting it into a bearish downtrend.
The SBUX stock price recently faced a rejection from a resistance level, leading to a breakdown below the $97.27 support. This decline has shifted the price into a downtrend. Over the past four trading sessions, the price has broken down through the $93.82 level with the help of a strong bearish candle, indicating the dominance of sellers in the market.
Currently, the SBUX stock price is heading towards the $88.51 level. If it successfully reaches this level, there might be a minor correction around $93.82 before the price potentially drops further to around $83.10.
On the other hand, for the price to reverse and enter an uptrend, it needs to close above the $99.73 level. If it achieves this, there’s a possibility of an upward movement towards the $103.75 level.
Technical Indicators Analysis
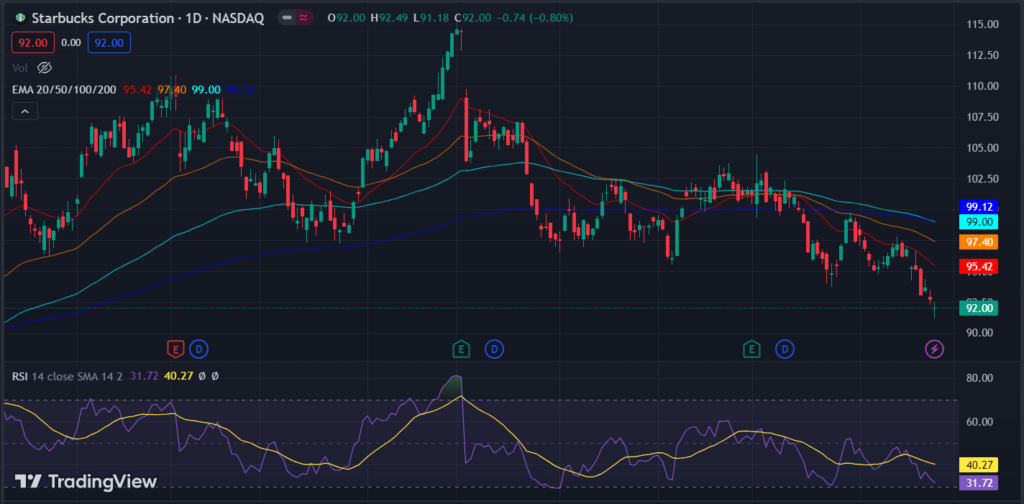
The stock price faced resistance from the 20 and 50-day EMAs and is trading below the 20,50,100 and 200-day EMAs and this shows the dominance of sellers over the price in the current session.
The relative strength index (RSI) trades at 31.72 and is sloping toward the oversold lower band on the 30 mark, indicating that the sellers are currently in control as they are pushing the price down and showing bearish strength.
Conclusion
The overall market structure is bullish, but the price is currently trading in a temporary bearish trend. So, the price is dropping toward $88.51 and will fall to $83.10 if it takes a bearish correction at $93.82. However, for the shift of price into uptrend, it should close above $99.73 then probably it will rise up to $103.75.
Technical Levels
- Resistance Levels: $99.73 and $103.75
- Support Levels: $88.51 and $83.10
Disclaimer
The views and opinions stated by the author, or any person named in this article, are for informational purposes only. They do not establish financial, investment or any other advice. Investing in or trading stocks comes with the risk of financial loss.




