
 Quack AI
 NEAR Protocol
 Quant
Quant Ondo
Ondo Zcash
Zcash Pearl
Pearl Sui
Sui
- Arbitrum coin price has surged by over 84% in a year.
- This platform is all set to launch “Arbitrum Japan” in partnership with Fracton Ventures.
The current market price of Arbitrum – $0.09291
What Arbitrum Coin Has Witnessed so far?
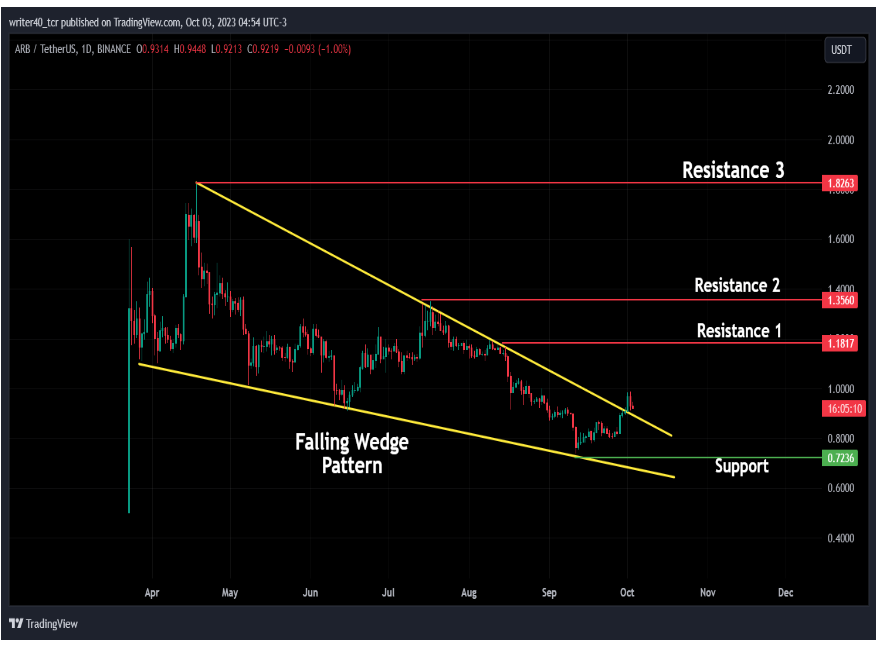
The ARB token price declined by 3.93% in the previous trading session. The stock has given a good breakout from the Falling Wedge Pattern. If we observe the price of the coin, it is trying to retest the pattern and is currently taking the support of the trendline. The token price soon after the listing has shown a great move on the upside. Its price has surged by over 260% in just one month of trading.
The ARB token price started declining in mid of the April month. Since then the price has witnessed selling pressure and is declining on every rise. The ARB token price is showing some strength at the lower level, which indicates that the buyers are still present in this counter. The price has started trading above the crucial resistance level of $0.915.
What Does the Price Action Tell About the ARB Coin?
The falling wedge pattern is a very popular bullish pattern and it seems that the price is positively reacting to the breakout. The support for the token price is present at the recent swing low of $0.7236, which is marked as support on the chart. ARB coin’s Price can face rejection near the level of $1.1817, which is drawn as resistance 1.
The ARB token price has surged by over 15% in a week, 4% in a mont, and 84% in a year which signifies that the price is bullish. However, the price has shown a downtrend after March 2023, which seems to have ended now. If the price continues this uptrend then it can face resistance near the $1.3560 and $1.8263 levels, apart from the resistance 1 discussed above.
Bollinger Band
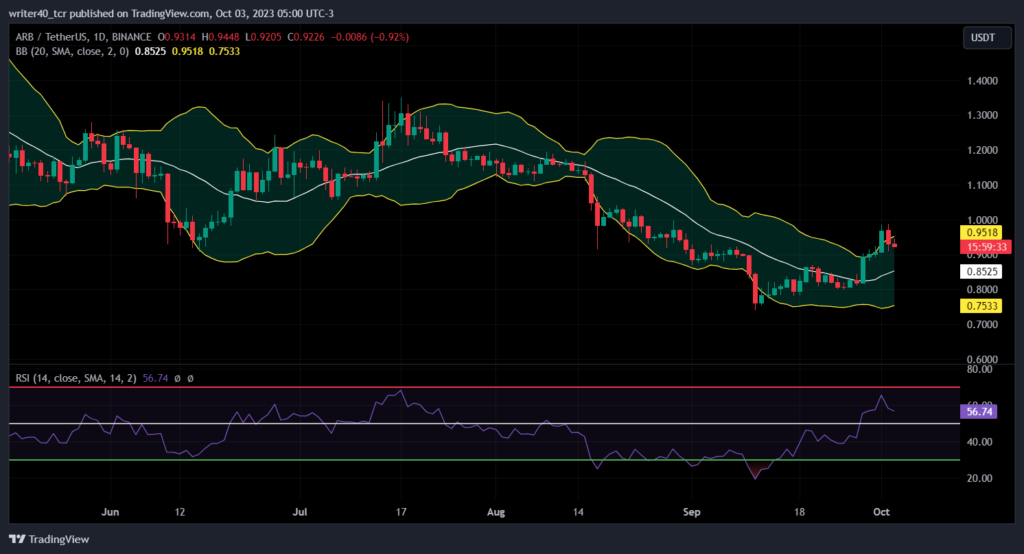
ARB coin price has closed outside the upper Bollinger Band and came back inside the band again. It indicates that the price has faced resistance outside the Bollinger band. The price will now try to test the median line of the Bollinger Band, which is present near the $0.85 level. The lower band is currently present near the $0.7533, which can act as support for the price.
Relative Strength Index
The Relative Strength Index is currently placed above the 50 level, which indicates that the bulls are gaining some momentum. The RSI has gone to the oversold region and then gained this momentum indicating that the price will try to continue this momentum ahead.
Conclusion
The ARB Coin has given a breakout of the Falling Wedge Pattern, and the momentum has been supported by the RSI indicator. It indicates that the price can try to continue this momentum further. If the price fails to sustain this level, then it can try to move towards the lower support level of $0.7236. If the price continues this trend, it can face the rejection near the level of $1.1817.
Technical Level
Resistance – $1.1817 and $1.3560
Support – $0.7236
Disclaimer
The views and opinions stated by the author, or any people named in this article, are for informational purposes only. They do not establish financial, investment, or other advice. Investing in or trading crypto assets comes with a risk of financial loss.




