
 Dacity Coin
 NEAR Protocol
 Quantus
 Bitcoin
 Celestia
 Pearl
Pearl Pudgy Penguins
- The EOG stock price has formed a double top near the $135 level.
- The company has paid a dividend of $8.88 in the previous financial year.
- This stock is trading above its 200-day Exponential Moving Average.
The market capital of EOG stock – $72.002 Billion
The current market price of EOG stock – $123.66
EOG Resource Stock Synopsis
The EOG stock price has witnessed a massive decline in the previous two days as the share price has declined by over 4%. The stock in its previous trading session declined by $3.10 with a fall of 2.45% in intraday trading. This fall has formed a big bearish candle on the daily chart. The EOG stock price has been consolidating in a range between $135 and $120 since July 2023.
If we observe the financial performance of the company over the years, the company has done well in every aspect. Its revenue has risen from $7.54 Billion in 2016 to $29.61 Billion in 2022. A rise of more than 290% in 6 years is a phenomenal growth in terms of revenue. The company was in a net loss of $1.10 Billion in 2016, which has turned positive and the current tally is $7.76 Billion. A rise of over 800%, which is an outstanding number.
EOG Resource Inc. has done significantly well to reduce its net debt. The Net debt of the company was $5.39 Billion in 2016, which has reduced significantly and the company is now a cash surplus. The company paid a dividend of $8.88 in the previous financial year with a dividend yield of 6.85%. It is considered one of the best in the market.
Technical Analysis of the EOG Resources
The EOG stock price at the beginning of this year has faced strong selling pressure, but the stock has recovered well after March 2023. The price has formed a base near the level of $105-$100 and then gave a breakout from the resistance level of $120. Currently, the stock is taking strong support from this level, which is marked as support 1 on the chart.
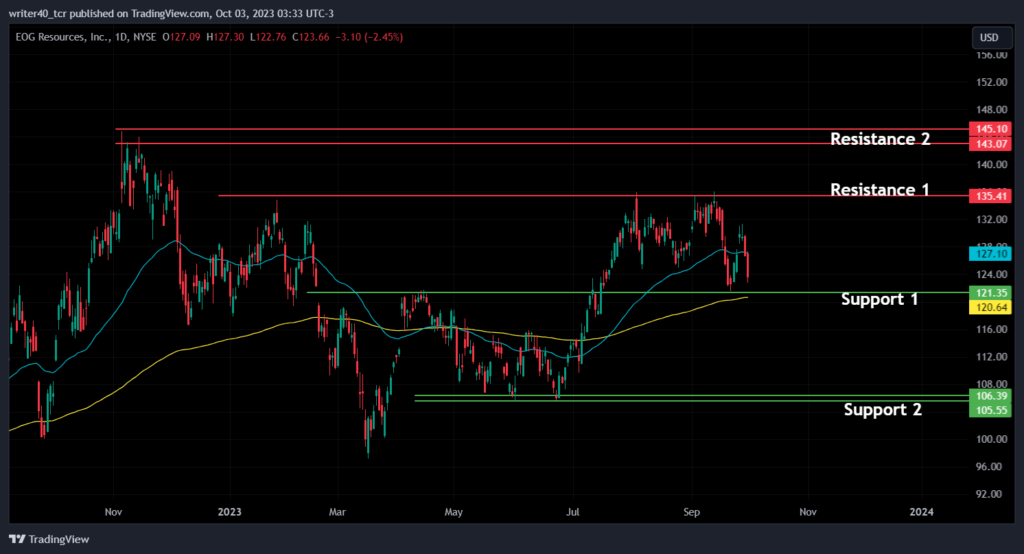
The price can face a rejection near the $135 level, which is currently providing an excellent supply to the stock price. The price has breached the 50-day Exponential moving average and is trading below that. However, the 200-day EMA is providing necessary support to the price. Both the 50-day and 200-day EMAs are present at $127.10 and $120.64.
The price can face some rejection near the level of $143-$145, which is marked as resistance 2 on the chart. The other support level for the price is present near the $105 level, where the stock has formed a strong base before this uptrend.
Conclusion
The price is trading very close to the support level of $120 along with the 200-day Exponential Moving Average. If the price breaks the support level of $120, it can move towards the level of $105. If it rises from the support level, the $135 can turn the price down.
Technical Level-
Resistance – $135 and $143
Support – $120 and $105.
Disclaimer
The views and opinions stated by the author, or any people named in this article, are for informational purposes only. They do not establish financial, investment, or other advice. Investing in or trading crypto assets comes with a risk of financial loss.



