
 Celestia
 Pearl
Pearl Quantus
 Zcash
Zcash Hyperliquid
 Aerodrome Finance
 NEAR Protocol
- FIL showed a significant rise of 64% in the active trades in the first quarter of 2023.
- There has also been an Increase in storage usage by 8% in Q2 2023. The revenue also increased by 91%.
- Let us delve into technical analysis of the coin. The coin does have the potential to make a recovery in the future.
In today’s session, the coin is not performing well. It fell by 2.53% due to the volatility in the price. In the last week, it performed well as Filecoin Price was up by 4.44%. One of the main reasons for the fall in the price of FIL is a decrease in the value of crypto assets.
According to the RSI indicator, the coin was below 30 which means it was oversold on some days of August.
Technical Analysis of FIL
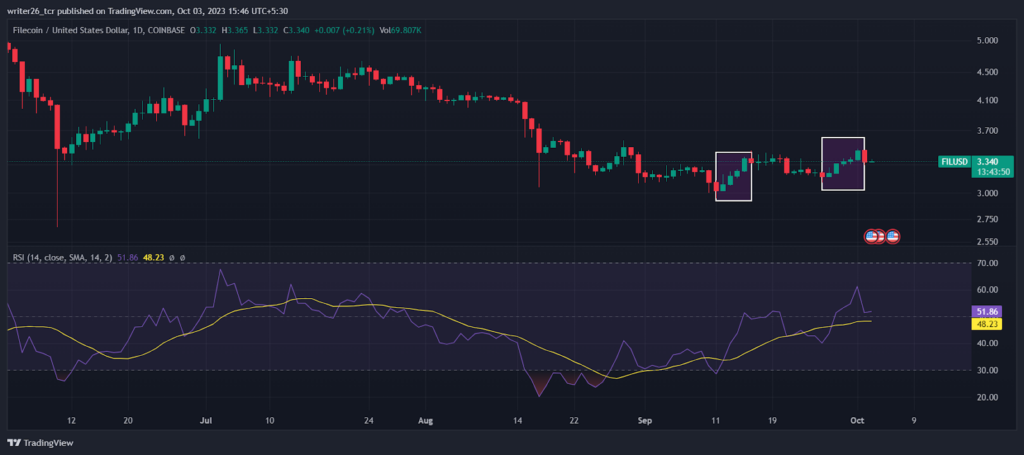
Last month, the coin formed some good bullish patterns which means that the chances of the coin making a new all-time low are low. The coin showed a sign of recovery in September as the coin was up by 6%. The reason for the fall in the price of the coin is BudBlockZ (BLUNT), which shook the market and affected the price of FIL. The reason for the fall in the price of filecoin is that BudBlockZ is the fastest growing company in the same field as FIL.
The market sentiments are currently neutral.
The F & I index helps traders in such a way that if the market is red, it means the price is falling then it is a good opportunity to buy. If the market is green, it means the price is rising then the selling opportunity becomes good for holders. Last month, it performed well as it was up by 5.12%. The data is fluctuating and the current data is provided in the article. The overall performance of the coin appears to be underwhelming, and there is a possibility that it could rebound from the current support level. The future direction of the coin’s price will depend on various technical factors.
Daily Exponential Moving Average(EMA)
| Value | Action (Buy or Sell) | Period |
| $ 3.34 | Buy | EMA 3 |
| $ 3.37 | Sell | EMA 5 |
| $ 3.33 | Buy | EMA 10 |
| $ 3.30 | Buy | EMA 21 |
| $ 3.41 | Sell | EMA 50 |
| $ 3.71 | Sell | EMA 100 |
| $ 4.30 | Sell | EMA 200 |
Daily Simple Moving Average(SMA)
| Value | Action (Buy or Sell) | Period |
| $ 3.39 | Sell | SMA 3 |
| $ 3.36 | Sell | SMA 5 |
| $ 3.29 | Buy | SMA 10 |
| $ 3.28 | Buy | SMA 21 |
| $ 3.33 | Buy | SMA 50 |
| $ 3.80 | Sell | SMA 100 |
| $ 4.39 | Sell | SMA 200 |
Live chart of FIL
Summary
In September, the coin performed well. The coin was moving down but in that month it gave some good indications of recovery. According to some reports, the coin might rise by 43.32% in the next 6 months, which would be quite impressive. Investors should watch this coin in October to see how it is performing then. They should think about whether to invest or not. It is compulsory to focus on both the fundamentals and technicalities of the coin. The chances of making a new all-time low are low as the coin is in a recovery phase.
Levels
Support level- $2.40
Resistance level- $5.00
Disclaimer
This is a general article that does not provide any financial or investment information. Investors should focus on both technical analysis as well as fundamental analysis. The analysis is done to provide information to readers. To make them aware of investments.




