
 Quack AI
 Pons
Pons Lighter
 Sui
Sui NEAR Protocol
 NeoSoul
 Quant
Quant
- It is currently trading at $0.0000072 with an intraday decline of 3.4%.
- The token is down from its all-time high by 91.75%.
The price of the SHIB has declined by almost 35% in the last 6 months. The token marked its yearly high of $0.0000157 in the last week of February. Currently, the price is trading in a sideways movement between the levels of $0.00000711 and $0.0000076.
The token marked its all-time high on 28th October 2021 when the token was priced at $0.00008845.
It is currently trading with a repulse in the trading volume of 0.40% in the last 24 hours.
The present circulating supply of the token is 589.35 Trillion SHIB which is 99.95% of its total supply. It has a current market capitalization of $4.29 Billion. The 24-hour trading volume of the token is $103.24 Million.
Sentiment Analysis
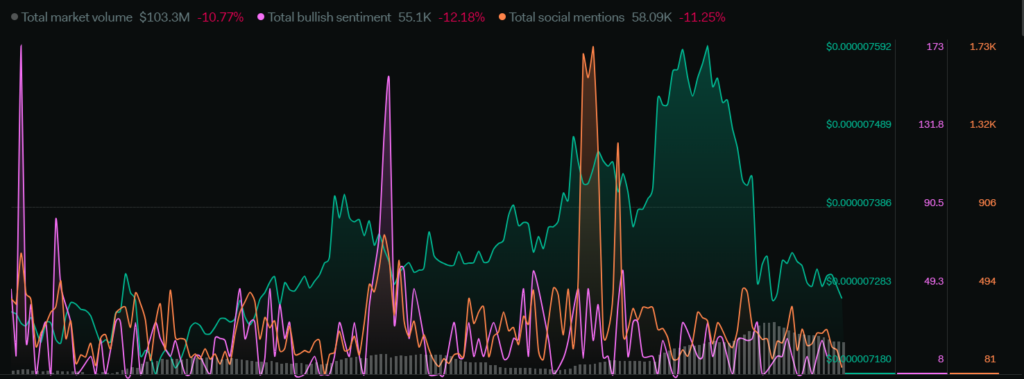
The total market volume of the token dropped by 10.77% in the last one week. The total social mentions have declined by 11.25%. The total bullish sentiments also decreased by 12.18%.
The overall sentiments are indicating a bearish movement in the price as the volume has decreased and the social community has not been active. The bullish sentiments also dropped due to the falling volume.
Technical Analysis of SHIB in Daily-1D Timeframe
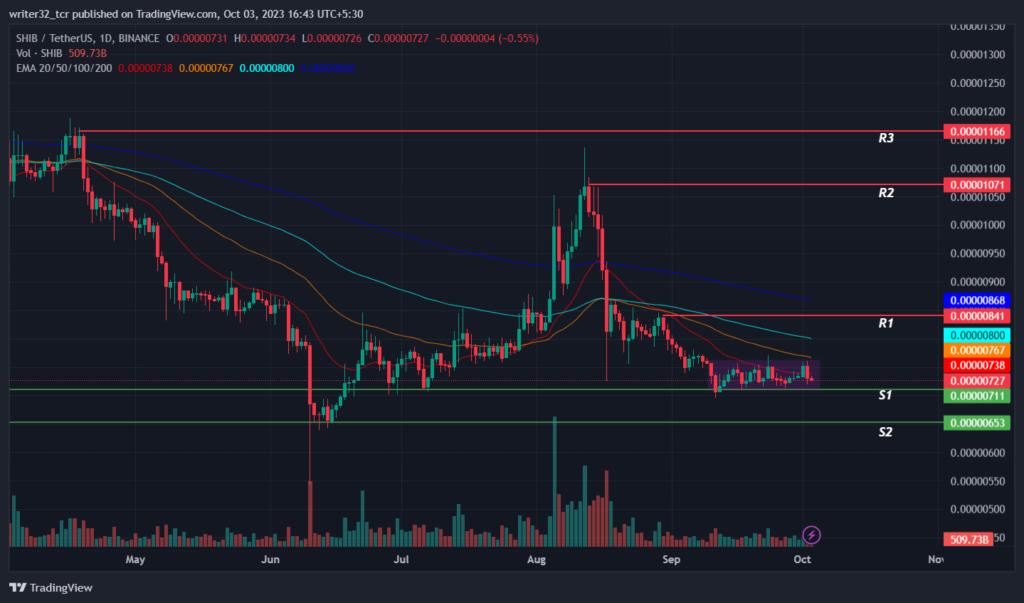
As can be seen in the chart, the price is currently moving in a sideways movement between the levels of $0.00000711 and $0.0000076. The price has to give a major movement out of this sideways zone so that the price can get a significant move.
If the price gives an upward movement out from the sideways zone with a good amount of volume then the price can break the resistance level of $0.0000084. If the price
breaks above the resistance level and gets above the 200-day EMA and sustains above it, then the price will be in a bullish scenario.
If the price breaks below the support level of $0.0000071 and the volume decreases, then investors will continue the downtrend further and the price can reach $0.0000065 which is the next support level for the price.
Currently, the price is below the 20, 50, 100, and 200 EMA’s which is a negative sign for the price.
Relative Strength Index (RSI)
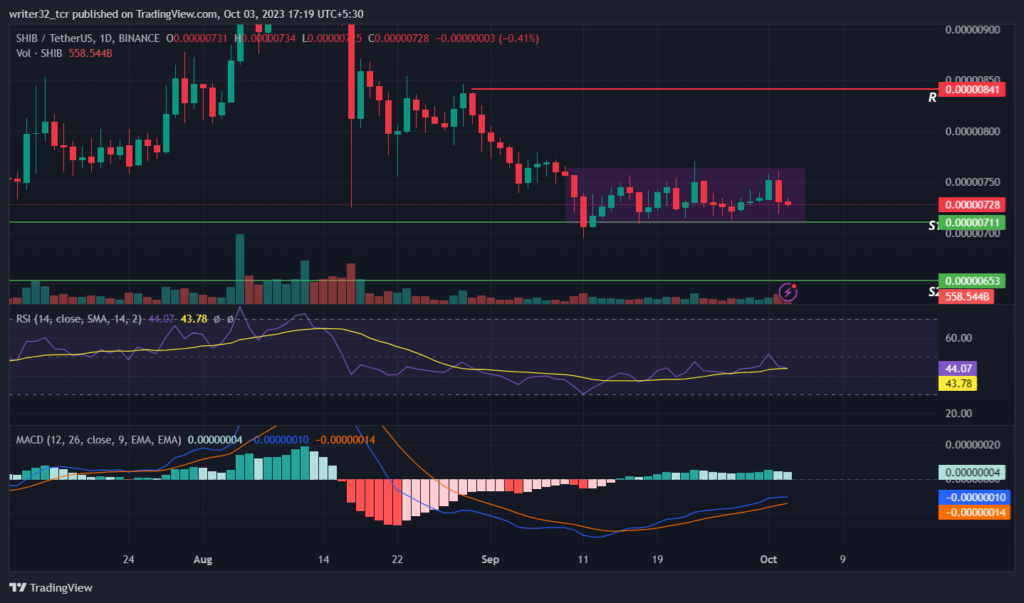
The RSI line is presently moving at 44.07 points and the SMA 14 line is moving at 30.91 points. The RSI is below the neutral level of 50. If the RSI decreases from the current level, then it will be a bearish sign for the price and it can also reach the oversold region.
Moving Average Convergence/Divergence (MACD)
The fast blue line moving average is above the red slow line moving average. The volumes in the histogram show a drop in the volumes which is also a bearish signal for the price as the SHIB price needs a sizable amount of volume if it wants a bullish movement.
Conclusion
The SHIB price as per current analysis seems to be bearish as the volume is not increasing and the social community is also not looking strong. The bulls have to enter the market and the social community has to be active to take the price in an upward direction.
Technical Levels
Support Levels: $0.0000071 and $0.0000065
Resistance Levels: $0.0000084, $0.0000107 and 0.0000116
Disclaimer
The views and opinions stated by the author, or any people named in this article, are for informational purposes only and do not establish financial, investment, or other advice. Investing in or trading crypto assets comes with a risk of financial loss.




