
 Boomer
 Pearl
Pearl Covenant x402
 Claudia
 Bitcoin
 hi
hi NEAR Protocol
- The PIXY stock price is trading above the $1.19 level, which becomes immediate support.
- The Bulls surged the price by more than 80% during the last two trading sessions.
ShiftPixy Inc. (NASDAQ: PIXY) is a listed company on the American Stock Exchange. It is a Human Resources Consulting Services Company and was founded in 2015. The company is revolutionizing employment in the gig economy by delivering a next-generation platform for workforce management.
The Current Market Performance of the Stock
The stock price is currently trading at $1.31 level with an exchange volume of 8,150,766 shares. The price has observed a decline by -14.38% of its value, during the intraday trading session. It was closed at $1.53 on the previous day. The PIXY stock holds a total market capitalization of $15,952,120 with an average trading volume of 4,956,318 shares.
Technical Analysis and the Price Prediction of PIXY Stock
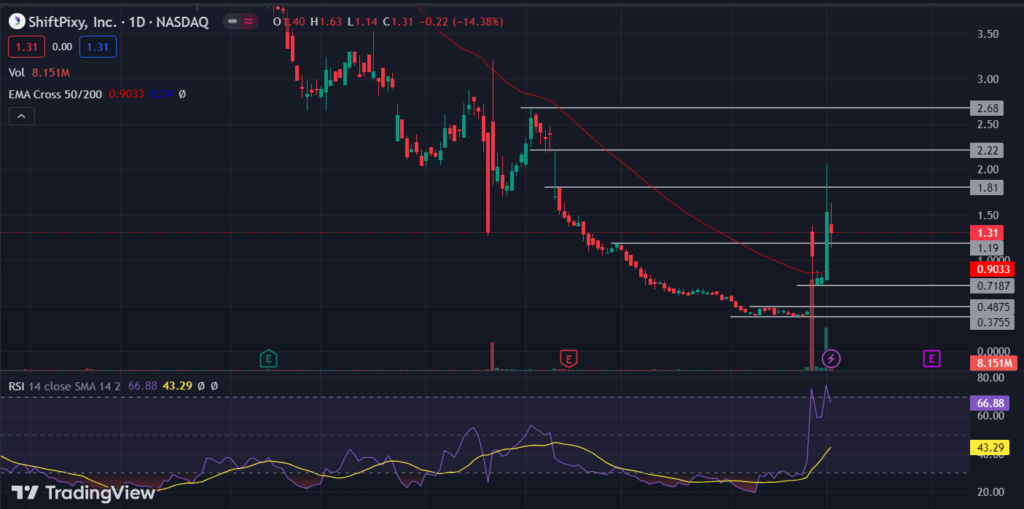
The stock price is below the 200-day EMA, trading in a bearish price structure by respecting the supply zones. The price has been performing below 50-day EMA since Jan 5, 2023. At present, it has broken above the 50-day EMA at $0.9033 level indicating the bulls have reappeared in the stock with strong momentum.
On the other side, the price has a last supply zone at $0.4875, which has now become a support level after the price opened gap up. It took support from the $0.7187 level, which gave the bulls enough strength to surge more than 80% in the last two trading sessions. However, it has major resistance at the $2.68 level. If the PIXY stock price somehow breaks above this level, there may be a formation of an uptrend.
Furthermore, the Relative strength index (RSI) shows a straight bullish impulsion. The momentum, which breaks above the 70 mark upper band, has formed a double-top-like pattern. It may have the possibility for a price reversal, but the bulls have an upper hand on the domination of the stock price as of right now.
Conclusion
The overall price structure of the PIXY stock chart is bearish. The price faced resistance from the $1.81 level, which probably became a pivot point for price retracement. So, if the price took proper support at the $1.19 level, it may reach its immediate resistance at $1.81. If the price breaks above this level, it may rise up to $2.68 major resistance. However, for the continuation of bearish sentiments, the price should close below $0.7187. After that, it may drop to its next support level at $0.4875.
Technical Levels
- Resistance level: $1.81 and $2.68
- Support levels: $0.7187 and $0.4875
Disclaimer
The views and opinions stated by the author, or any people named in this article, are for informational purposes only. They do not establish financial, investment, or any other advice. Investing in or trading stocks comes with the risk of financial loss.




