
 Pearl
Pearl Starknet
 Quantus
 Sui
Sui NEAR Protocol
 Pudgy Penguins
 Lighter
- Ripple got approval to provide payment services in Singapore.
- The XRP coin price has surged by over 6% in a week and 15% in a year.
- The XRP coin is trading in a range created by the giant bearish candle on 17th August.
The Current Market Price of the XRP Coin- $0.5331
XRP coin’s price is trading in the current session with a decline of $0.0051 or 0.96%. The coin price started the trading session with some selling pressure but as the day progressed the price showed a recovery. Currently, the XRP coin’s price is forming a shooting star kind of candlestick on the daily chart. That indicates the buyers are present at the lower level.
XRP coin’s journey has been a roller coaster ride for investors as the coin has shown some amazing movement on both sides. Soon after the listing the XRP’s coin saw a decline of over 94% from highs but recovered well after the consolidation. After the coin price surged by over 1000%, it again showed a decline of over 85%. The price has followed the same pattern for so long.
The XRP coin price is trading in a tight range of a big bearish candle the price made on 17th August 2023. Since then, the price has not been able to cross the high and low of that candle. The high of that candle is $0.5948 and the low at $0.4226. It will act as a strong resistance and support.
Insight of the chart
The XRP coin price has shown a sharp decline from the upper levels. If we look closely at the chart, the price has formed a rising trendline. It is acting as a support for the token price. The XRP coin price is facing rejection from the previous resistance level of $0.552, marked as resistance 1 on the chart. Apart from this, the price is taking strong support from the level of $0.4191, which is marked as support 1 on the chart.
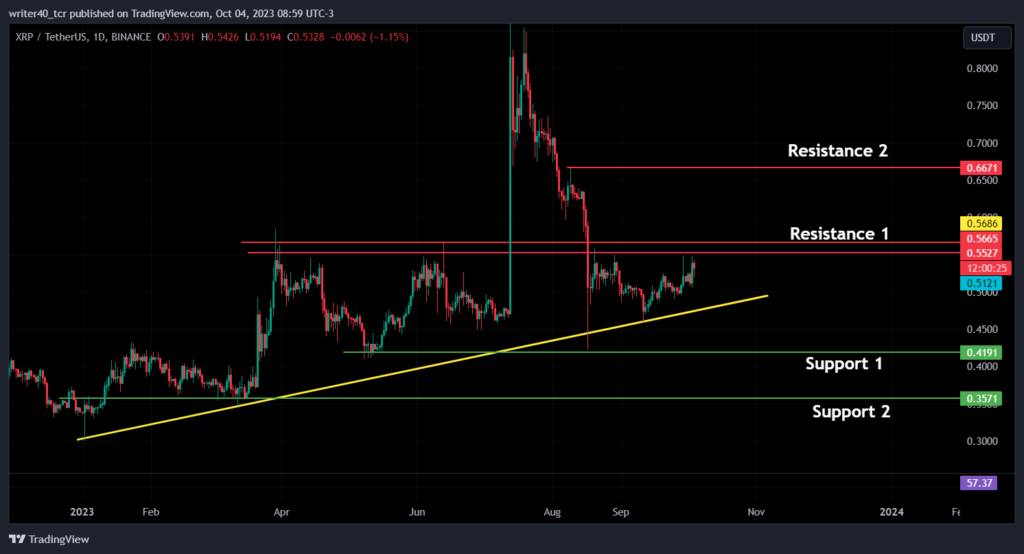
The other support for the price is present at $0.3571 which is marked as support 2. The coin price can face rejection at $0.6671 apart from the $0.552 level. The XRP has declined massively but the recovery is very dull which indicates that the buyers are not in much control over the price.
Are Indicators telling a different story?
Exponential Moving Averages
The XRP coin price is trading above the 50-day Exponential Moving Average but below the 100-day EMA. It indicates that the traders are confused about the direction of the coin. The 50-day EMA has shown a sharp decline along with the price.
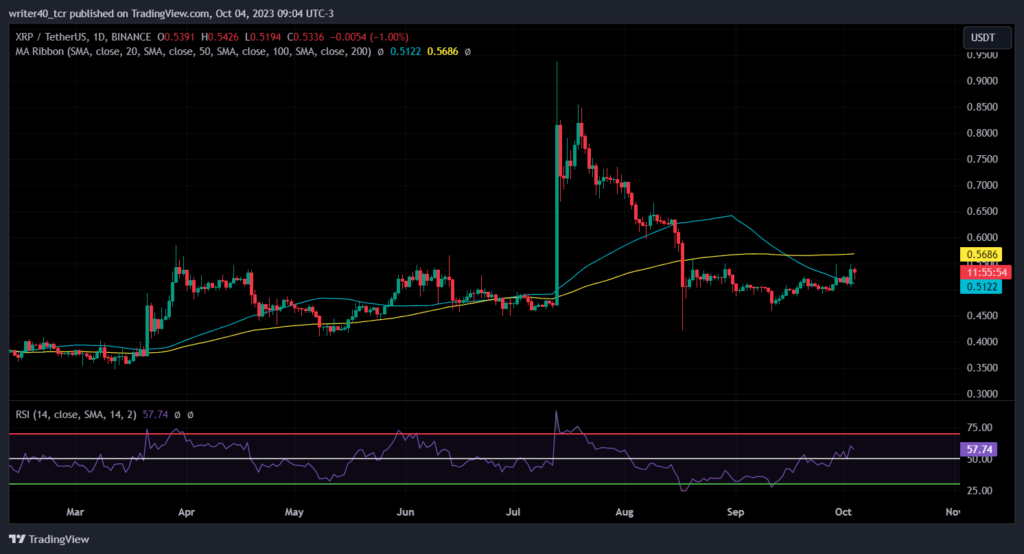
The Relative Strength Index (RSI) is currently trending up. This indicator has shown a divergence with the price, which shows that the price can try to move up in the coming days. The RSI is currently placed above 50 level which is a bullish sign for the coin.
Conclusion
XRP coin price is trading very close to the resistance level of $0.5527 and the RSI is indicating that the buyers are gaining momentum. If the coin price breaks the resistance level of $0.5527, it can try to achieve the $0.6671 level. If the coin breaks the support level of $0.4191, it can try to achieve the lower level of $0.3571.
Technical levels
Resistance – $0.5527 and $0.6671
Support – $0.4191 and $0.3571
Disclaimer
The views and opinions stated by the author, or any people named in this article, are for informational purposes only. They do not establish financial, investment, or other advice. Investing in or trading crypto assets comes with a risk of financial loss.




