
 streamoors
 IGNITION
 NEAR Protocol
 Injective
 LayerZero
 Pearl
Pearl Hyperliquid
- Finger Motion is an American recharge platform and mobile payment solution operating in China. The market capitalization of the FNGR stock is $238.11 Million.
- The company was founded in 2015 by Martin J. Shen. The share of the company is listed on the National Association of Securities Dealers Automated Quotations (NASDAQ).
- Let us interpret the stock to gain some information about the FNGR stock.
Technical Analysis of the FNGR Share
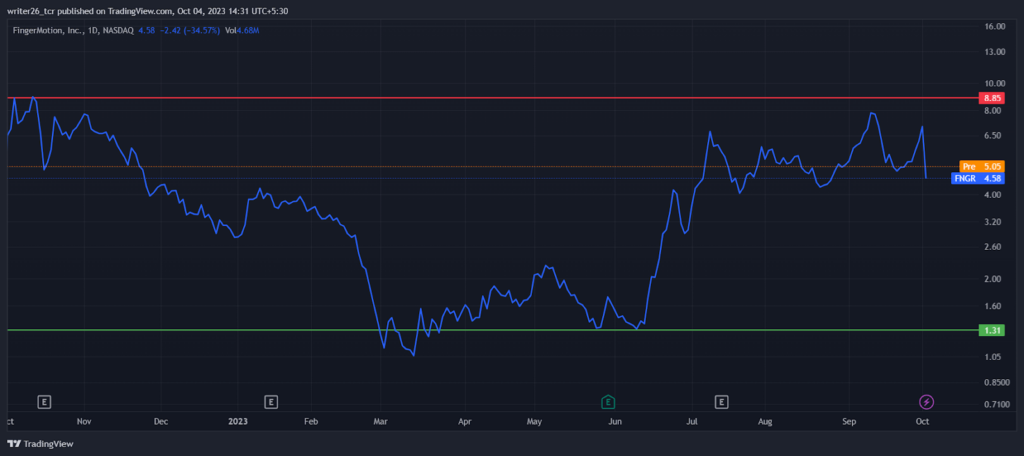
The line chart indicates that the FNGR stock is between a range of resistance and a support level. Since October 2022, it has been behaving in the same way. The stock is not able to break the resistance level for a single time. Both the levels are acting strong due to multiple formation of points on the levels. Today, it is down by 34.57%. The current market price of the FNGR share is $4.58. The stock in the 5-D was down by 13.58%. In the previous month, it was down by 21.71%. In the previous 6 months of 2023, it was up by 193%.
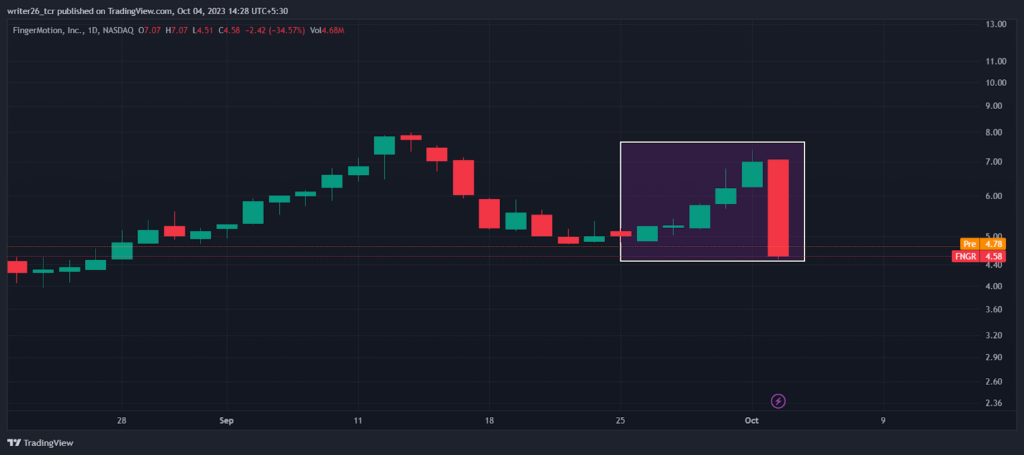
In recent trading days, the bull run continued to move up but failed after the formation of a big red candle. The red candle indicates that the price will start to move in a downward direction. The price dropped from $7.07 to $4.58 in a single trading session. All in all, it has given good returns to its investors as it was up by 138%. In September, the stock was in bullish momentum but after 11th September the bull run started to take control. According to predictions made by experts, the stock may fall to $3.37 by 23 October 2023. The fall will be around 18.67%m, which is very huge for any stock. So, the chances of short-selling are high. The presence of bears can be expected from the predictions. The F&I Index shows 39 (Fear). Its price-changing rate has been around 36.91% over the last 30 days.
Long-term price prediction of FNGR
| Year | Prediction | Change |
| 2024 | $ 10.54 | 130.03% |
| 2025 | $ 24.23 | 429.12% |
| 2026 | $ 55.74 | 1,117.11% |
| 2027 | $ 128.22 | 2,699.67% |
| 2028 | $ 294.95 | 6,339.97% |
| 2029 | $ 678.46 | 14,713.61% |
| 20230 | $ 1,560.64 | 33,975.14% |
Fundamental Analysis of FNGR
Finger Motion Total Revenue in 2022 was 34,054,205, which got a boost as compared to the previous year. The Operating Loss increased as compared to the previous year. Its Operating Loss in 2022 was -6,666,065.
The Net Loss increased as compared to the previous year. The Net Loss in 2022 was -7,539,142.
Live Chart of FNGR
Conclusion
According to the analysis, it might fall in the upcoming trading session. The prediction can be inaccurate. FNGR stock can continue to move in the same way for some more time till it gives any breakout. The fundamentals are also not so strong. So, investors should wait for some time before they make any investment or financial decision.
Technical Levels
Support level- $1.31
Resistance level- $8.85
Disclaimer
This is a general article that does not provide any financial information. Investors should focus on both technical analysis as well as fundamental analysis. The analysis is done to provide information to readers. To make them aware of investments.



