
 Minter
 Quack AI
 NEAR Protocol
 Sui
Sui Hyperliquid
 Cardano
 Raydium
- The 50-day EMA made a bearish crossover with the 200-day EMA which caused a downfall of more than 6%.
- The bulls got trapped by a false hidden bullish divergence signal indicated by the RSI.
PepsiCo, Inc. (PEP) was founded in 1965. It is an American Multinational food, snack, and beverage corporation and one of the largest companies in North America. The company, through its operations, contract manufacturers, and other third parties, has engaged in producing, marketing, distributing, and selling a range of foods, snacks, and beverages.
Recent Financial Market Performance of the PepsiCo Inc.
The company has been performing well for the past few years. In the last year, the company recorded $86.39 Billion in revenue. It increased by 8.70% compared to the year 2021, reflecting the average growth rate of the company.
According to the quarterly data, the company has observed an increase of 10.37% in its revenue. However, the PEP stock price has seen a bearish rally in the month of May. It is constantly moving in a downtrend to date.
The company has distributed a dividend of $5.06 per share, while the current yield is at 3%. It has reported its price-to-earning (P/E) ratio at 29.58, which is slightly higher compared to the company’s rivals.
PepsiCo, Inc. (PEP) holds a total market capitalization of $232,683,420,677 with an average volume of 4,399,064.
Technical Analysis and Price Prediction of the PEP Stock
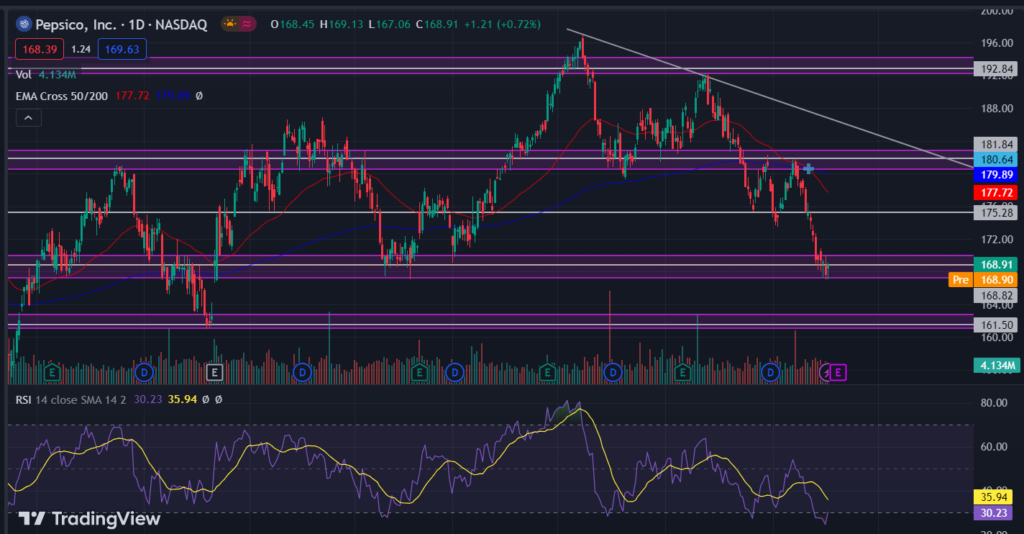
The PEP stock price is trading below both the EMAs. The 50-day EMA made a bearish crossover with the 200-day EMA, which caused a downfall of more than 6%. It created a bearish sentiment in the stock price. At present, the 50-day EMA is at the level of $177.72 whereas the 200-day EMA is at $179.89.
The price is currently trading at $168.91 level after falling from the $181.84 immediate supply zone. At present, the price is halting at the $168.82 major demand level. The bulls are approaching that level, but the RSI reflects less momentum strength.
The Relative Strength Index (RSI) line is sloping below the 30-mark lower band, currently resting in the oversold region. Recently, the RSI has reflected the false bullish divergence, which trapped buyers at that level.
Conclusion
Overall, PepsiCo, Inc. (PEP) stock price currently trading in a short-term downtrend. The stock price is halted in the demand zone. If the price breaks below the demand zone, we expect it to drop to the $161.50 level. However, for the continuation of the major trend, it should break above the $181.84 resistance. Thus, it may probably have the possibility to make a new all-time high price level.
Technical Levels
- Resistance Levels: $181.84 and $192.84
- Support Levels: $168.82 and $161.50
Disclaimer
The views and opinions stated by the author, or any person named in this article, are for informational purposes only. They do not establish financial, investment, or any other advice. Investing in or trading stocks comes with the risk of financial loss.




