
 Puffer
 ZKsync
 Bitcoin
 NEAR Protocol
 Pearl
Pearl Quantus
 Sui
Sui
- DOGE has been trading with a lateral movement for a few weeks.
- It is currently trading at $0.0603 with a decline of 1.5% in the intraday trading sessions.
- The token is down by 91.79% from its all-time high.
DOGE is the only memecoin which comes under the top 10 cryptocurrencies around the world on the basis of market capitalization. The token has been facing a downfall for a long time, as the value of the token has decreased by 28.6% in the last 6 months and by 7.44% in the last 3 months.
The token recorded its all-time high on 8th May 2021, when it was priced at $0.7376.
The token is presently trading with a surge in trading volume by 11.2% in the last 24 hours.
- It has a market capitalization of $8.53 Billion.
- The total supply of the token, which is 141.33 Billion DOGE, is currently circulating in the market.
- The 24-hour trading volume is $104.25 Million.
Sentiment Analysis
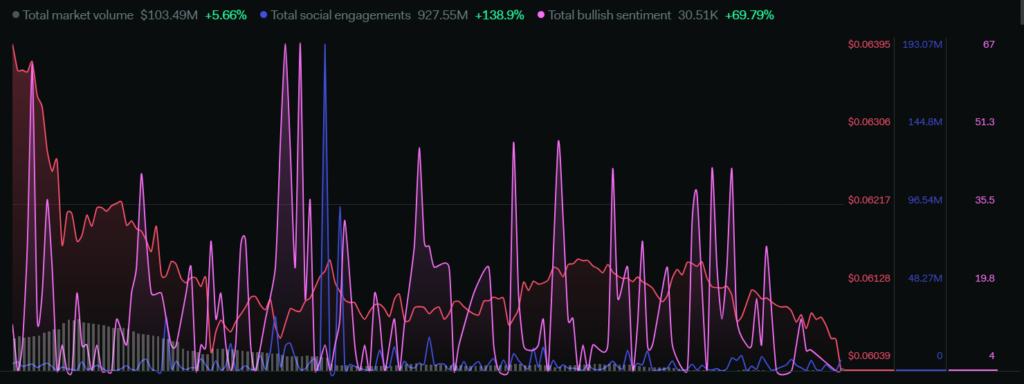
The total market volume has increased by 5.66% in the last week. The social engagements have risen by 138.9% and the total bullish sentiments have surged by 69.79%. The overall sentiments indicate a positive movement for the token. As the volume is surging and the social community is engaged, the bullish sentiments are also increasing.
Technical Analysis Of DOGE ( Daily-1D )
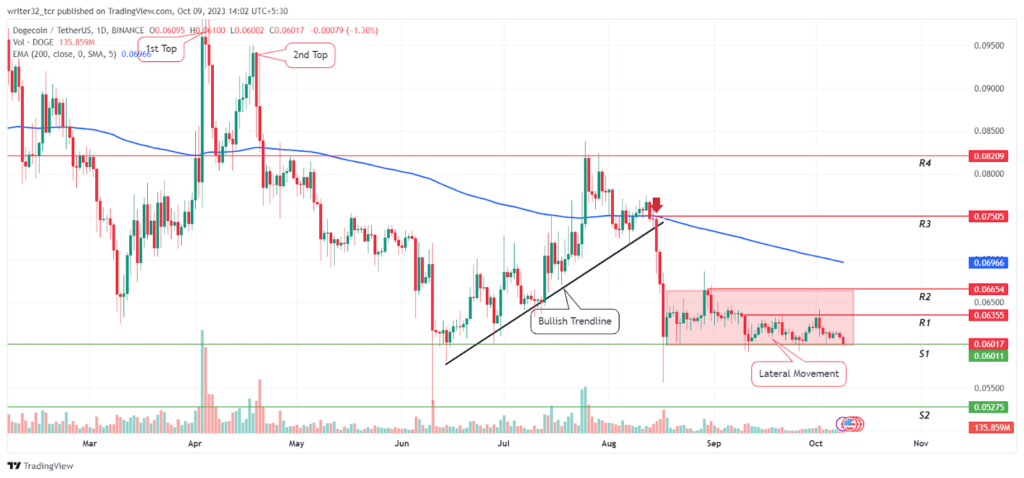
As we can see in the chart, the price of DOGE marked its yearly high of $0.105 in the beginning of April. Subsequently, the token made a second top at the level of $0.95. This resulted in a double top pattern from where the price turned bearish.
After turning bearish, the price faced a downfall to the level of $0.0600 from where it took support and started to move on a bullish trendline. After making higher highs on the trendline, the price got rejected from the resistance level of $0.082. Subsequently, the price started coming down and broke below the trendline.
DOGE price is currently moving in a lateral movement between the levels of $0.060 to 0.063. It is presently trading at the support level from where the price will probably take support again from the same support level of $0.060. If the price took support and broke above the resistance levels of $0.063 and $0.066, then the price can get up till $0.070. Once the price starts to trade above the 200-day EMA, it will become bullish.
However, if the price got rejected from the resistance level of $0.063, then it may continue its lateral movement or fall further.
Indicators on the Price Of DOGE
Relative Strength Index (RSI)
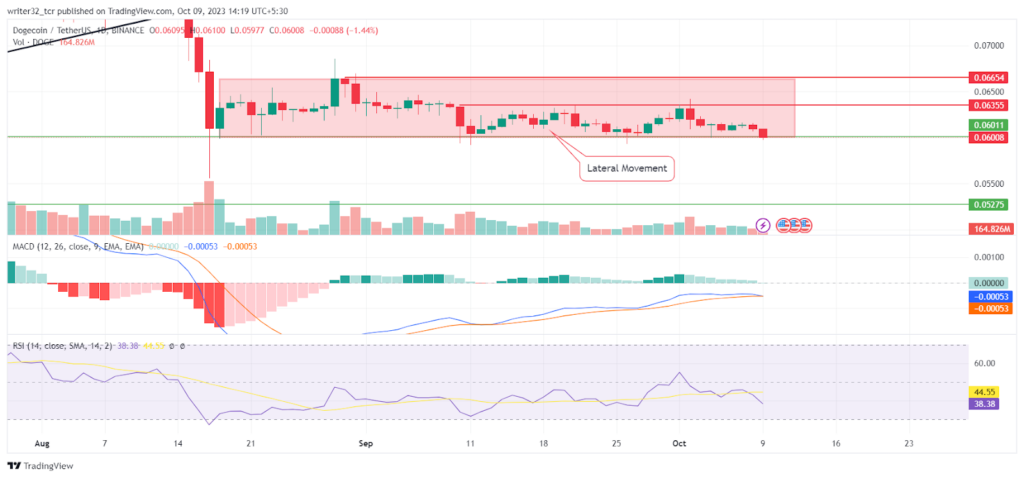
The RSI line is presently moving at 38.38 points and the SMA 14 is moving at 44.55 points. They are both below the neutral level of 50. The RSI will soon enter the oversold region from where the price can get a positive reversal.
Moving Average Convergence/Divergence (MACD)
The fast blue line moving average will soon cross and get below the red slow line moving average. The histogram is showing significant falls in volumes which is a bearish sign. The volume can start increasing as soon as the price successfully retests the support.
DOGE LIVE CHART
Conclusion
The price of DOGE is currently at the support level, trying to retest the support and if the price successfully retests the support with a good volume, then it can go up. On the other hand, the price can fall further if it breaks below the support level of $0.060.
Technical Levels
Support: $0.060 and $0.052
Resistance: $0.063, $0.066, $0.075 and $0.082
Disclaimer:
The views and opinions stated by the author, or any people named in this article, are for informational purposes only and do not establish financial, investment, or other advice. Investing in or trading crypto assets comes with a risk of financial loss.




