
 Minter
 Quack AI
 Starknet
 NEAR Protocol
 Sui
Sui Hyperliquid
 Bittensor
- QCOM stock closed at $110.88, with a gain of 0.98% in the past intraday session.
- QCOM stock price is contesting the 20-day EMA and is approaching the 50-day EMA.
Qualcomm Inc (NASDAQ: QCOM) stock observed a long wick candle in the past intraday session. This signals a bullish trend reversal, and the price might spike toward the $113 mark.
Recently, QCOM stock closed at $110.88 while witnessing a gain of 0.98% in the past intraday session. Moreover, the current market capitalization is $123.74 Billion, with an average volume of 6.4 Million shares.
QCOM stock price shattered after forming strong resistance at $132 level. Due to the price faced strong pressure from sellers at $132 mark, and slid towards the recent support level of $105. However, the price bounced up from the support level of $107 in intent to retest the prior top, but failed miserably in that.
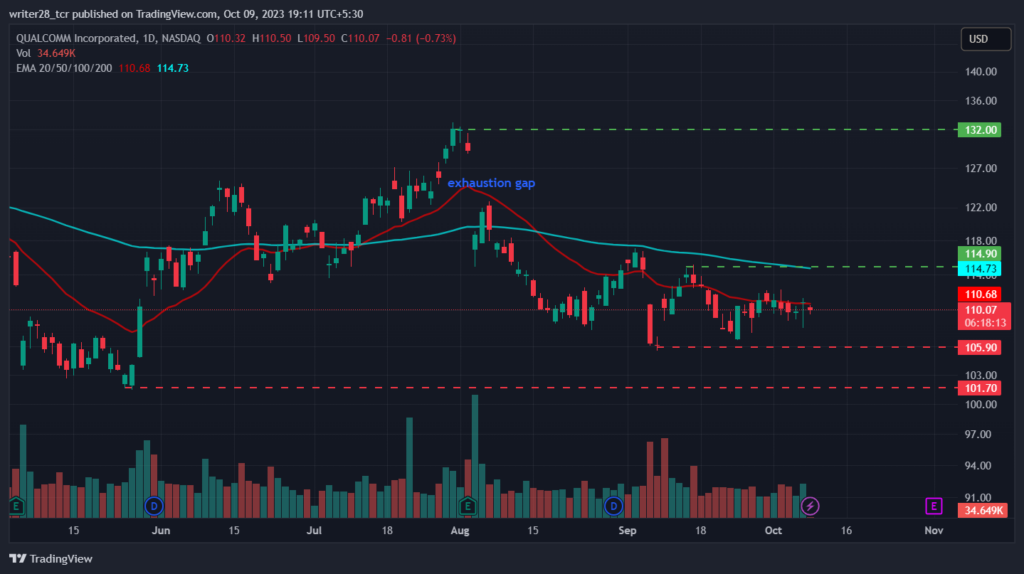
During the recent bearish trend, QCOM stock price faced an exhaustion gap on August 3 and September 7, 2023. The gap occurred due to a significant shift from buying to selling activity. This elevated the downtrend further, and the price was rejected from the long and short-term moving averages.
Following the exhaustion gap in September, buyers made an effort to break through the $117 mark but faced rejection, leading to a downward reversal. Despite this setback, a bullish sentiment still lingers in the price action.
If Qualcomm Inc. attracts more buyers and the price goes above the significant resistance level of $114.90, it might head toward the next potential resistance level of $117. On the other hand, if the bearish momentum is sustained and the price moves below the $105 support level, then it might retest the annual low of $101.47.
Will the Bearish Momentum Sustain?
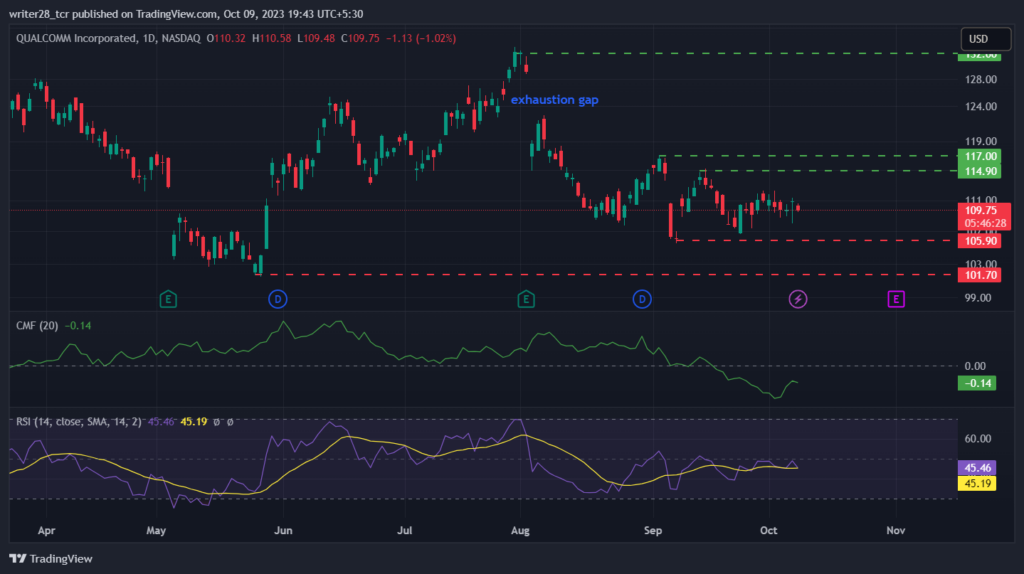
The QCOM stock price has dropped below the 50, 100, and 200-day exponential moving averages (EMAs), indicating a rise in sellers’ participation. However, the past month’s meltdown has diluted the price immensely.
The Chaikin money flow score has been trading below the 0.00 mark since September 18, 2023, and is at -0.14, suggesting weakness and heavy dominance of bears in the market in the past few weeks.
The relative strength index (RSI) stands at 45.46, away from the 50-neutral zone, indicating slight pressure from the bears’ side. However, the price might witness a strong rally if the bullish momentum prevails.
Conclusion
The market structure and price action of Qualcomm Inc. stock has been following a downtrend over the past few months. If Qualcomm Inc attracts more buyers in the upcoming time, the price might surge toward the resistance level of $117. Most technical parameters suggest neutrality, with signs of a bullish trend reversal.
Technical Levels
Major resistance: $139.94 and $132.97
Major support: $104.11 and $105.51
Disclaimer
The views and opinions stated by the author, or any people named in this article, are for informational purposes only. They do not establish financial, investment, or other advice. Investing in or trading crypto assets comes with a risk of financial loss.




