
 Pearl
Pearl Bitcoin
 NEAR Protocol
 Starknet
 Solana
 Quant
Quant Ondo
Ondo
- SO stock is selling for $67.10 on the market. Currently, SO has a market value of $71.649 billion.
- Solar project in South Cheyenne is purchased by Southern Power. It is the thirty-first solar project of Southern Company.
- During today’s trading, the SO stock is up by 0.99%. Let’s use technical analysis and technical indicators to examine the SO stock price.
The strong fundamentals of Southern Company (SO) make it a desirable investment opportunity. The company had a Net Income of $3.54 billion in 2022, an increase by $1.13 billion from the year before. It made $29.3 billion in profits in 2022, an increase by $6.06 billion from the previous year. Additionally, its Operating Income for 2022 came to $5.66 billion, an increase by $391.00 million from the previous year.
The SO stock performance has seen substantial growth over time, with the stock increasing by over 1,202% over the course of its entire history. Even over the last five years, the SO stock has experienced rapid growth, rising by 53%. It had a growth rate of almost 9.11% the year before. The SO stock is in good financial shape especially when it is compared to the previous year. Southern Co., was founded in 1945. It is the largest energy provider in the United States. It is ranked 126th on the Fortune 500 list.
Live Chart of SO Stock
Technical Analysis of SO Stock
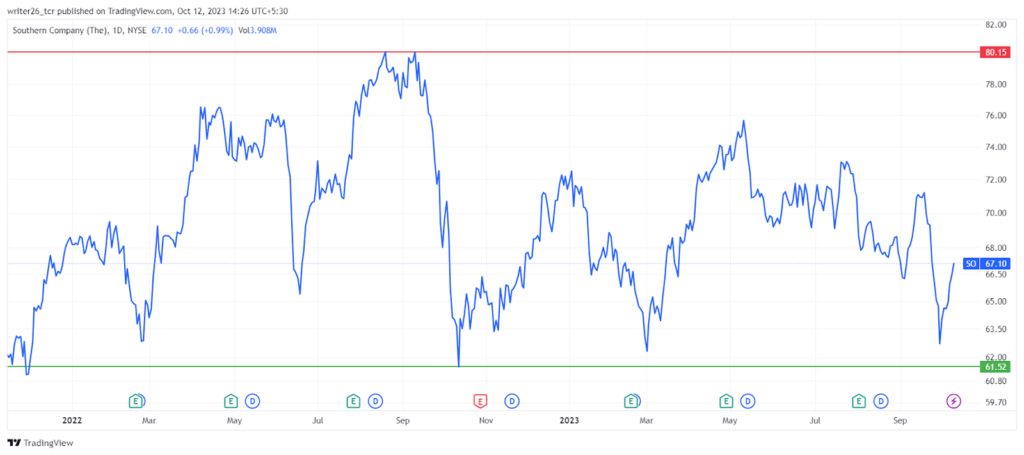
The SO stock is between a range of resistance and a level of support, according to the line chart. It has been behaving the same since January 2022. The stock has failed to break through the resistance level even once. Because there have been several point formations on both levels that are acting strongly.
The 5-D stock increased by 4.14%. It had decreased by 2.19% over the previous month. It has decreased by 6.96% over the preceding six months of 2023.
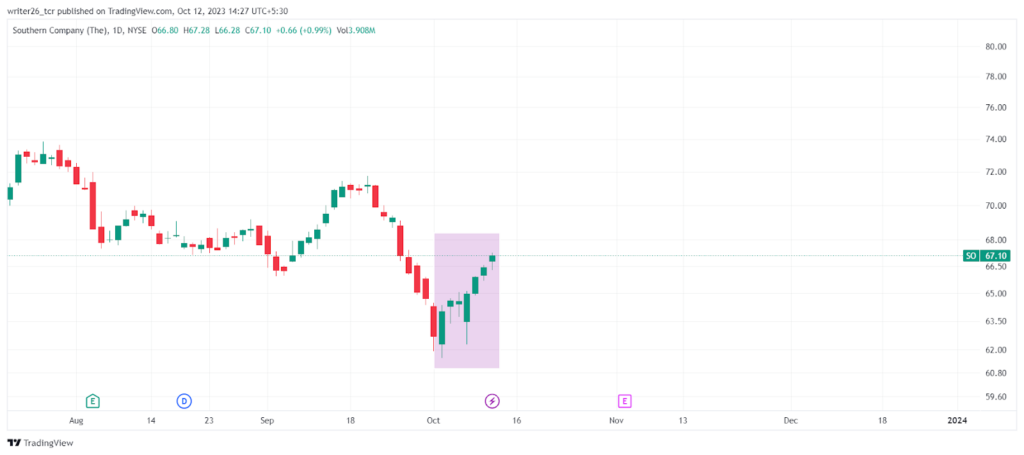
In recent trading days, the bull run kept moving upward. The price will soon begin to trend upper, according to the green candles. In the last 7-D trading sessions, the price increased from $61.50 to $67.10. Overall, it provided its investors with good returns because it increased overall. The stock has positive momentum in the monthly time frame. In September the bear rally got going till 02 October 2023.
By October 17 2023, experts believe that the stock could drop to $63.74.
5.00% of the stock will decline which is a pretty significant amount. So, there is a strong likelihood of short sales. The prediction suggests that bears will be present. The F&I Index reading for Fear is 39. Over the past 30 days, its price has changed at a rate of about 3.50%.
SMA and EMA (50,100,200)
Simple Moving Average
The SMA 100- $69.36 (Sell)
The SMA 200- $69.36 (Sell)
Exponential Moving Average
The EMA 100- $68.76 (Sell)
The EMA 200- $69.27 (Sell)
Conclusion
The SO stock seems to have solid fundamentals and could be a worthwhile purchase based on both technical and fundamentals analysis. The financial performance of this company was outstanding. Even if there are frequently brief changes. It has consistently grown over the long term. It might continue its same momentum for some more time.
Technical Levels
Support level- $63.46
Resistance level- $80.18
Disclaimer
This is a general article that does not provide any financial information. Investors should focus on both technical analysis as well as fundamental analysis. The analysis is done to provide information to readers. To make them aware of investments. All the data is fluctuating due to stock market hours. It might change when readers read the article.




