
 Pearl
Pearl Bitcoin
 NEAR Protocol
 Starknet
 Solana
 Quant
Quant Ondo
Ondo
- The BIDU stock price is following an uncertain market structure.
- The Baidu Inc. stock is less volatile than the overall market.
Baidu Inc. is a transnational technology company that began in China and has its headquarters in Beijing. The current CEO of the company is Yan Hong Li and his company has more than 41K workers. The company was established in 2000 and serves worldwide. Baidu Inc. stock is tarded as BIDU and listed on NASDAQ exchange.
The BIDU stock is trading with an average volume of 1.90M while the company has 276.408M shares available for trading. BaiduInc. has a price-to-earnings rate of 20.96, which indicates that the investors are willing to pay advanced prices than the EPS of the company, and the current EPS of the stock is $ 6.49.
The Baidu Inc. has given a return of 6.90% on equity and also has reported a return of 3.85% on assets. The current operating margin of the company is 15.30% followed by a neutral debt/equity ratio of 38.73%. The company has a very good price-to-book value of 1.46. The current ratio of the coin is 2.83 which indicates that the company is capable of paying its debt over time.
Baidu Inc. Stock Performance Analysis
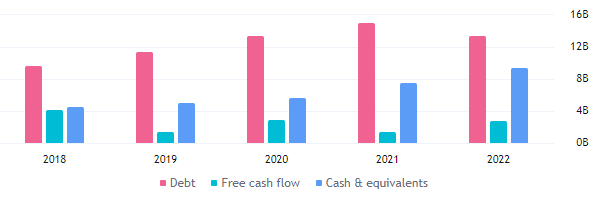
The profit for Baidu Inc. has slightly declined by $1.0 B in the time ending 2022 when compared with the time 2021. The net income of the company is $1.03 B performing in a profit periphery of 5.63. The company also reported a decline of $1.71 B in the debt of the company over time. It has an operating income of $.363 B and has reported an advance of 41.8B in the net income in the recent quarter result of the company.
Performance Analysis of BIDU Stock
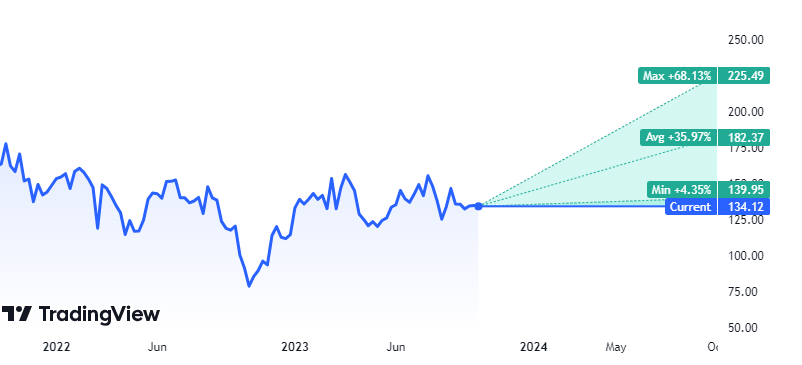
The Experts of Tradingview are highly bullish for the BIDU Stock and are aiming for a maximum target of $225.49 which is currently 68.13% above the CMP. The average price of the stock calculated is also much higher than the CMP. The expected average price of BIDU stock is 36.00% above the current trading price of the BIDU stock.
Traders Getting Bullish On The Stock, Will BIDU Stock Lead To A Breakout?
a by writer11_gsm on TradingView.com
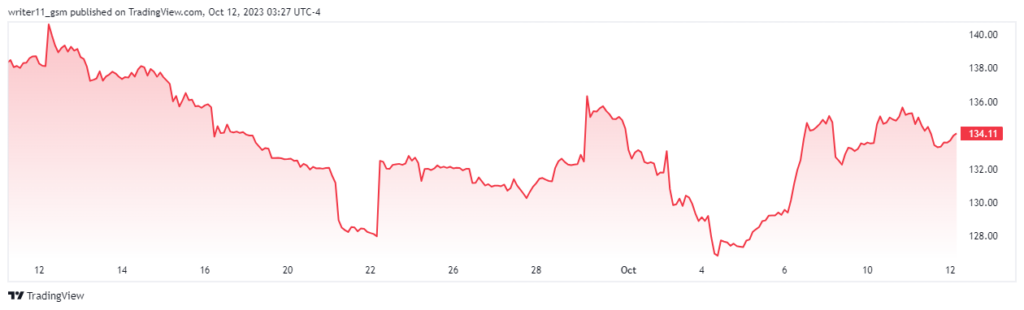
The BIDU stock price has been consistently contracting its range by forming lower highs and lower lows. This behavior of the stock price has formed a symmetrical triangle pattern on the charts. The price is still revolving inside the same pattern.
The 50-day and the 200-day EMA are trading in a golden cross but the stock price has declined below the EMAs. Both the EMAs has also contracted showing signs of reversal in the stock trend. We might get to see a death cross on the charts in the upcoming days.
The RSI of the Bidu stock is currently trading at the 50-level and is taking support over the same. The current scenario in the RSI looks uncertain to mildly bullish.
Conclusion
Baidu Inc. has reliable finances and has maintained its revenue and debt over the years. The analysts and experts are also bullish in the stock. The EMAs are indicating weakness in the stock price and the RSI is indicating uncertainity. The current price structure is also totally uncertain as the stock is trading inside the symmetrical triangle pattern.
Therefore, if the BIDU stock price breaks above the triangle pattern we might get to see a huge upmove in the share price. If the stock breaks below the trinangle pattern then the market price can decline to further lower levels.
Technical Levels
- Support levels- $116.00 and $126.00
- Resistance levels- $147.00 and $156.00
Disclaimer
The information provided in this article, including the views and opinions expressed by the author or any individuals mentioned, is intended for informational purposes only. It is important to note that the article does not provide financial or investment advice. Investing or trading in cryptocurrency assets carries inherent risks and can result in financial loss.




