
 Zcash
Zcash Sui
Sui Celestia
 Quantus
 Injective
 Hyperliquid
 LayerZero
- The NWG stock price is at $5.76.
- In the last intraday session, the stock price gained 1.05%.
NatWest Group Plc (NYSE: NWG) is a global banking company. It works in the sector of international banking and provides financial services.
NatWest Group Plc (NWG) Stock Analysis
The NWG stock price experienced a surge of 1.05% in its last trading session and closed its trading session at $5.76. It is a large-cap company with a market capitalization of $24.983 billion. It trades with an average 10-day trading volume of 1.288 Million.
1-Day Chart Analysis OF NWG Stock
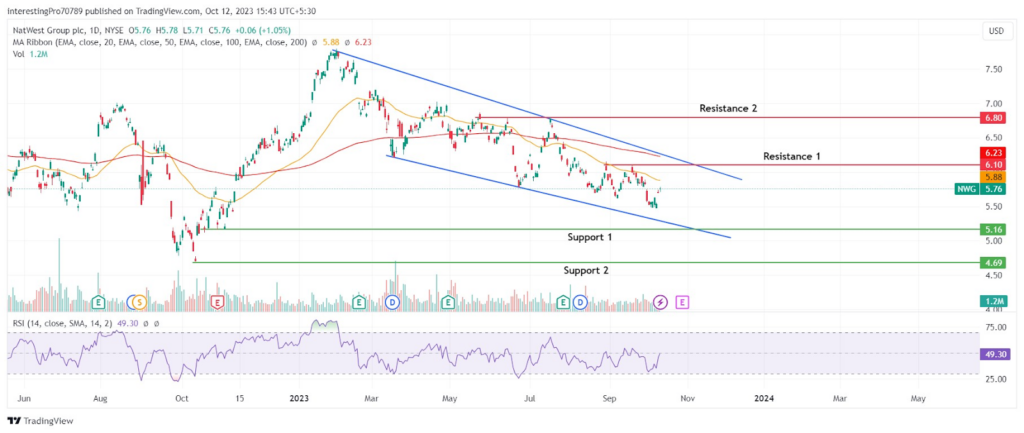
The NWG stock price is in a continuous downtrend and is trading inside a falling parallel channel. The price is currently moving in the upward direction with a very minor gap left by it.
The price is approaching the 50-day EMA. If the price faces rejection from this level, it may continue its downtrend. However, if it reclaims the 50-day EMA, it can rise to test the 200-day EMA.
The relative strength index (RSI) is at 49.30 and is trending in the upward direction. If the price falls after facing rejection from the 50-day EMA then the RSI will adjust itself. Then it will start to slope in the downward direction. Currently, it is in neutral territory facing pressure from both buyers and sellers.
In the current scenario, the price is rising. If the price faces rejection from both the 50-day EMA and the $6.10 resistance level, it may fall to its next support at $5.16 and if it breaks below this level then it may fall to its next support at $4.69.
However, for the price to gain bullish momentum it must reclaim the $6.10 resistance level along with the 50 and 200 EMAs, and sustain above them. Then it would rise to its next resistance at $6.80.
Conclusion
The overall trend of the NWG stock price is bearish. The price is currently rising and approaching the 50-day EMA and the $6.10 resistance level. If the price faces rejection at these levels, then it would continue its long-term bearish trend and could fall to its support at $5.16. If it also breaks below this level, then it may continue its fall to its next support at $4.69.
However, for the price to gain bullish momentum it must reclaim the $6.10 resistance level and sustain above it. After this, it could reach its next resistance level at $6.80.
Technical levels
Resistance Levels: $6.10 and $6.80.
Support Levels: $5.16 and $4.69.
Disclaimer
The views and opinions stated by the author or any other person named in this article are for informational purposes only. They do not provide financial, investment, or other advice. Investing or trading comes with a risk of financial loss.




