
 Dacity Coin
 Injective
 Solana
 Celestia
 Starknet
 Quantus
 NEAR Protocol
- CitiGroup announced its Q3 of 2023 results on 13 October 2023. This bank today reported Net Income for Q3, 2023 of $3.5 billion.
- The market value of C stock is $79.782 billion. It is currently trading at $41.43 right now.
- Let us analyze the CitiGroup stock price and use technical analysis to learn about the stock.
The CitiGroup (C) stock almost increased by 142% over the history of the stock. The stock in the preceding year rose by 3.06%. CitiGroup was founded on 8 October 1998. It decreased by 41% over the last 5 years. It is the fourth-largest banking institution in the U.S.
The CitiGroup’s financial situation is not good compared to last year. The company’s Revenue in 2022 rose by $21.42 billion from the year before to $101.59 billion. In 2022, it had an Operating Income of $19.30 billion. Compared to last year, it fell by $8.38 billion. The firm’s Net Income in 2022 was $14.73 billion. It had decreased by almost $7.07 billion over the last year.
Live Chart of CitiGroup
EMA and SMA (50, 100, 200)
Exponential Moving Average
The EMA 100- $43.62 (Sell)
The EMA 200- $45.49 (Sell)
Simple Moving Average
The SMA 100- $44.31 (Sell)
The SMA 200- $46.27 (Sell)
Technical Analysis of CitiGroup
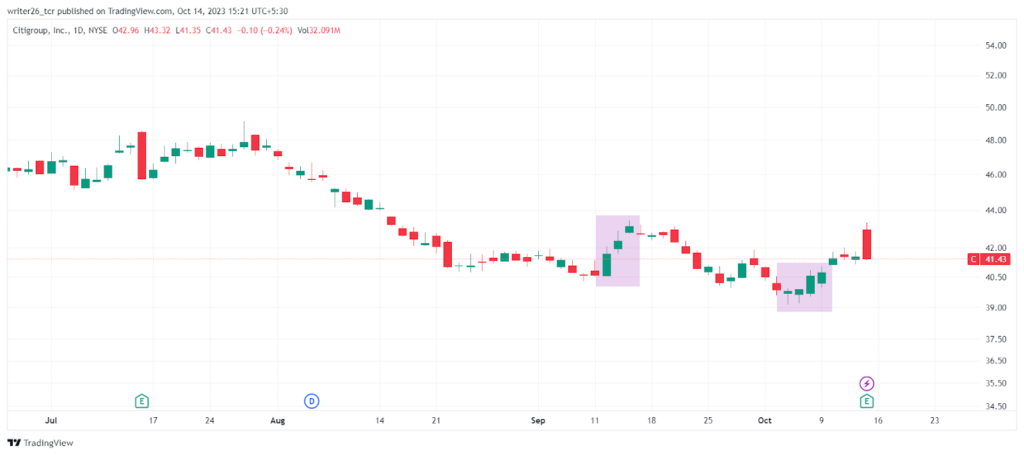
The “Bull or Bullish Pattern” is the name of the formation. This pattern develops while the price is dropping and predicts that after forming, the price tried to rise and the bulls tried to push the price in the up direction. It implies that the price will continue to incline over the course of a day and it moves in the upward direction. The bearish market sentiment is currently prevalent in C stock.
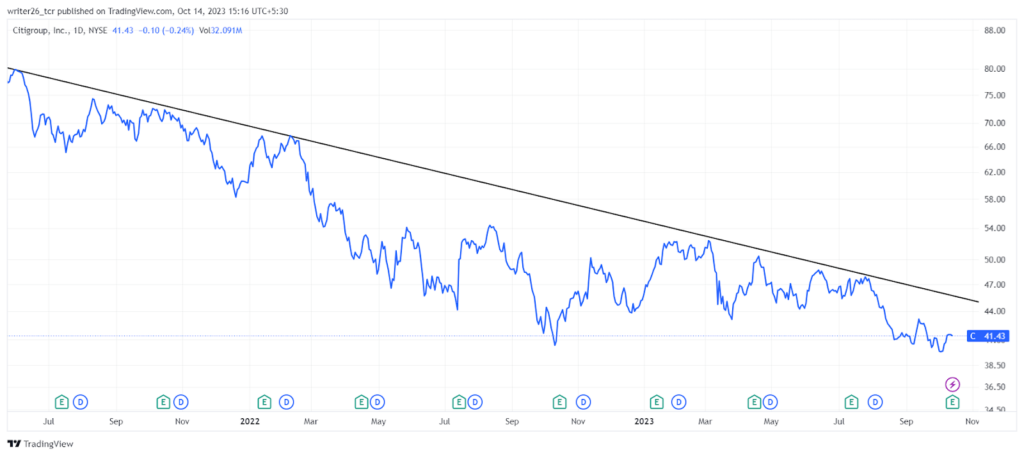
This stock has displayed a clear pattern of resistance along a persistent downtrend line, reinforcing its downward trajectory since September 2021. The bearish momentum has remained a dominant feature, signified by the ongoing descent.
Notably, on December 28, 2006, in the daily time frame, CitiGroup shares achieved their all-time high (ATH) at approximately $569. However, recent performance shows a modest 0.24% decrease today. Nonetheless, a broader view in the daily time frame analysis reveals continued challenges, with the share seeing a marginal fall of just $0.10.
Conclusion
According to the analysis, we can conclude that the CitiGroup stock is not doing well during the course of a one-day timeframe. The research is complete to present technical data on the CitiGroup stock. In the future, it might rise by 2.54% which means it might reach the $42.48 price level by 19 October 2023. Last month, it decreased by 1.22%, and in the preceding 6 months, it decreased by 13.99%. It increased over the course of 5-D by 3.11%. Due to its momentum which is bearish, it is not appropriate for short-term duration. The chances of breakout are only possible when the stock can break its support or resistance level.
Technical Levels
Support level- $42.98
Resistance level- $52.21
Disclaimer
The views and opinions stated by the author, or any people named in this article, are for informational purposes only and do not establish financial, investment, or other advice. Investing in or trading crypto or stock comes with a risk of financial loss.




