
 Quantus
 Injective
 Bitcoin
 Quant
Quant Pudgy Penguins
 Raydium
 Bittensor
- The Israel and Hamas war can affect the Meta’s revenue.
- The Meta Platforms stock has been rated with an “Overweight” rating by JP Morgan.
- It has surged by over 160% in the year 2023.
The Meta Platforms stock is in a strong bullish trend as it has surged by over 160% from the year’s low. The stock price has taken a hit of over 77% in the last year. This massive decline in the stock was triggered because of pressure created in digital marketing-based companies. There is a huge decline seen in the budget of digital spending from the clients. This impacted the revenue of the stock.
Meta Platforms stock has shown a V-shape recovery at the beginning of this year. It has been rising in a strong bullish momentum and helped investors gain some smart money in a short span of time. During this uptrend, the stock price has formed some gaps which shows, how aggressively bulls are pushing the price up. The stock price is inching closer to its all-time high level of $384.33.
Meta Platforms stock halted this strong bullish momentum in August 2023. After this, the stock price showed some correction of around 15% which was necessary at that time. It has been exhausted and definitely needed a correction. However, the stock was rated by the rating firm JP Morgan. It has maintained its previous rating of “Overweight” on the stock and cut down the target price to $400.
A Short Glimpse of the Meta Stock Chart.
The META company share has taken strong support near the level of $286.15. This is acting as a very crucial support for the stock as it has been tested more than three times. The stock has witnessed a strong momentum after it witnessed a golden crossover in the 50-day and 200-day Exponential Moving Average. Currently, the price is trading above both the EMAs which is a positive sign for the stock.
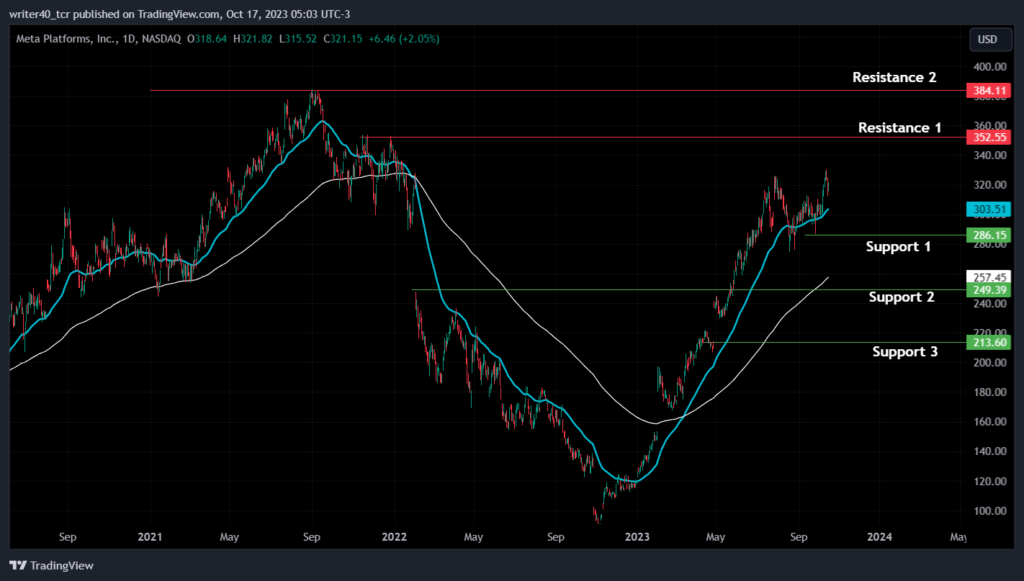
The Meta stock has created some strong demand and supply zones in this upward trend. If we consider the support levels, then it is present at the level of $286.15, $249.39 and $243.60. These levels are marked as green on the chart. $352.55 and $384.11 can act as resistance levels for the stock, which is marked in red.
Are Indicators Bullish and Bearish on the Meta Stock?
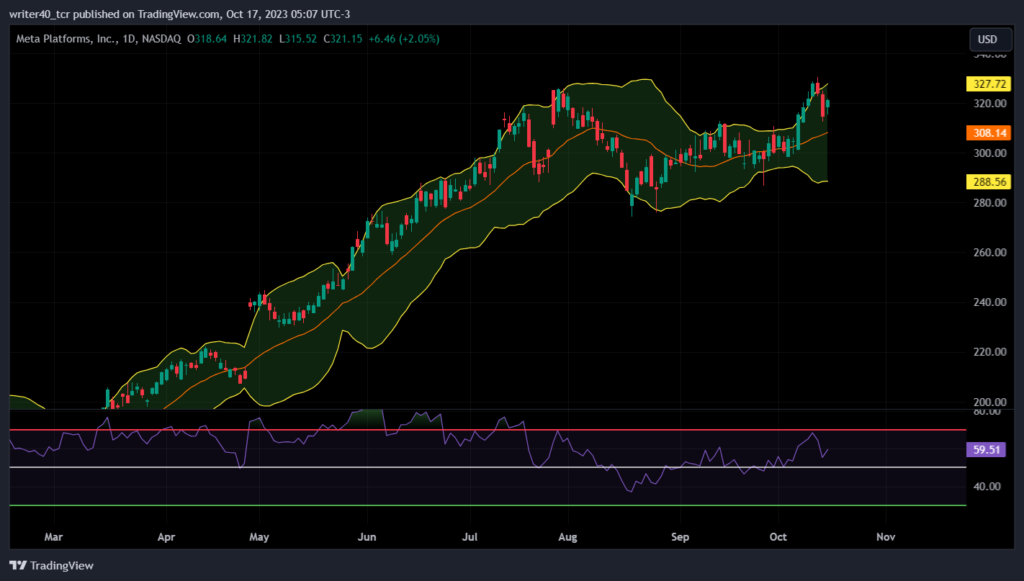
The Meta stock has recently closed above the upper band of the Indicator. Soon, it swiftly came back inside the band and formed bearish candles. This can be an early sign of some correction. The lower band of the indicator is placed at $288.56 which can act as support for the stock. The Relative Strength Index is curving above the 50 level which is a bullish sign. The slope of the RSI is rising which is also a positive sign.
Conclusion
The Meta stock is inching closer to higher levels but the current conflict in the Middle East can affect its business. If the price reacts to this news and starts declining, then it can move towards the level of $288.56 and $249.39 level. However, a continuation of this momentum can lead the price towards the level of $352.55 and $384.11.
Technical Level
Resistance – $352.55 and $384.11
Support – $288.56 and $249.39
Disclaimer
The views and opinions stated by the author, or any people named in this article, are for informational purposes only. They do not establish financial, investment, or other advice. Investing in or trading crypto assets comes with a risk of financial loss.




