
 Boomer
 Minter
 Pearl
Pearl Pudgy Penguins
 Quantus
 Quack AI
 Bitcoin
- The HD stock price has given a breakout from the ascending channel.
- The 50-day and the 200-day EMAs are sloping on the verge of crossover.
Home Depot, Inc. (NYSE: HD) is an American multinational home improvement retail corporation. It engages in the sale of building materials and home improvement products. The company sells tools, construction products, appliances, and services including fuel and transportation rentals.
The Company’s Stock and the Financial Overview
The company has observed an increase of 4.13% in its revenue in the current year. The annual revenue of the firm is $157.40 Billion along with a net income of $17.11 Billion. The annual net income is increased by 4.03%. However, the stock price declined almost 7.58% in the current year.
In the quarterly statement, the revenue declined by -2.00% compared to the year-to-year change. The earnings-per-share (EPS) for the year 2023 has increased by 7.47% while the EPS of July 2023 declined by -7.92%. It also impacted the HD stock price, which has been falling almost -3.39% for the three months.
The firm has set a one-year target price of $350.00 while having a yearly price range of $347.25 to $267.865. It has forwarded the annualized dividend of $8.36 per share with a current yield of 2.86%. The stock has a price-to-earnings (P/E) ratio of 18.23 with earnings-per-share of $16.01.
The HD stock price holds a total market capitalization of $291,939,261,465 with an average volume of 3,666,474.
Technical Analysis of the HD Stock
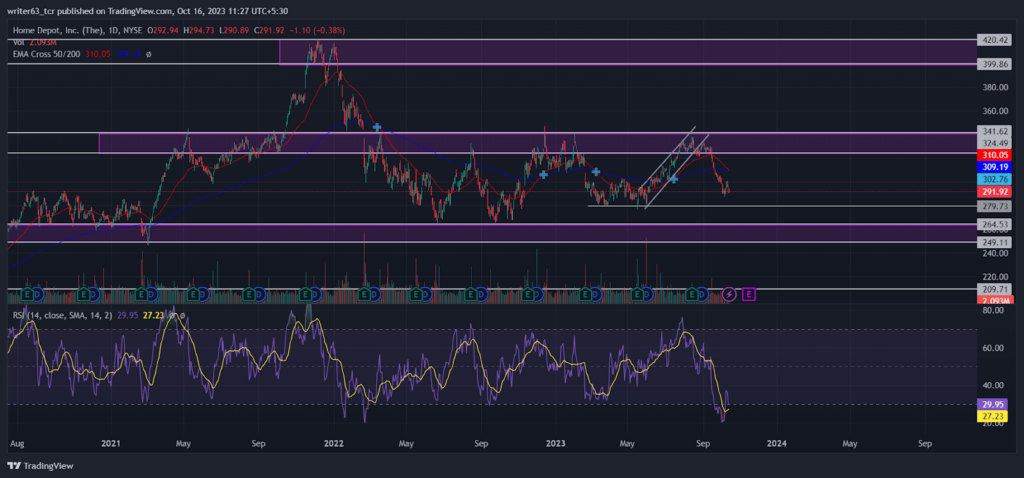
The stock price is performing below the 50-day EMA and the 200-day EMAs, which indicates the bearish trend. Both the EMAs are sloping on the verge of a bearish crossover showing the bears have control over the current trading phase.
At the press time, HD price is trading at $291.92 between the two important ranges of $249.11 to $341.62. According to the price chart, after the breakdown of the ascending channel at $324.49. The price is currently moving toward the lower range. If it closes below $279.73 then, it may probably strike down the $264.53 level.
Furthermore, the relative strength index (RSI) shows some hidden bullish divergence. However, at the current trading phase, there is no other possibility for a bullish rally. So, it would be a false signal.
Conclusion
The HD stock price is trading at $291.92 in a bearish price structure. Therefore, the price prediction for this stock would be bearish. The price is currently moving toward the immediate support level of $279.73. If it closes below that level, it may fall to the next support level at $264.53. However, if the price closes below the $249.11 level, we may see a confirmation for the future declines.
Technicals Levels
- Resistance levels: $305.75 and $324.49
- Support levels: $279.73 and $264.53
Disclaimer
The views and opinions stated by the author, or any people named in this article, are for informational purposes only. They do not establish financial, investment, or any other advice. Investing in or trading stock comes with the risk of financial loss.




