
 Dacity Coin
 Quantus
 Celestia
 Bitcoin
 Pearl
Pearl Hyperliquid
 Pons
Pons
- The revenue of Amazon.com Inc. has consistently advanced over the years.
- AMZN is known for one of the highest market caps in the world.
Amazon.com, Inc. is a multinational company that focuses on technology-related services like cloud computing, e-commerce, online advertising, digital streaming, and artificial intelligence. It is also known to be America’s Big Five American technology company. Amazon was founded by Jeff Bezos in Washington in the year 1994.
Amazon.com, Inc. has a huge market cap of $1.36T and a PE ratio of 103.21. This shows that the investors are ready to pay higher prices for AMZN stock. Its current beta is 1.36 which indicates that the AMZN stock is slightly more volatile than the overall market.
The company has 8.988B shares floating in the market available for trading and 12.40% of the total shares are held closely by the investors. The company generates the highest revenue from online stores and the highest percentage of revenue comes from North America.
The average volume of the AMZN stock traded over the last three months is 53.23M shares. The AMZN stock has an EPS of 1.27 USD which represents that the company is making $1.27 on each share.
Amazon.com Inc. Stock Performance Analysis
Experts Rating For AMZN Stock
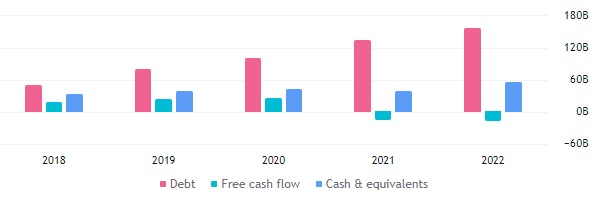
Amazon.com Inc. has shown consistent advance in revenue but the profit margin of the company has suddenly declined in the year 2022. The reported revenue of the company for the year 2022 is $513.95B but this has resulted in a negative profit margin of -0.53%. This resulted in a negative net income of -$2.72B in the year 2022.
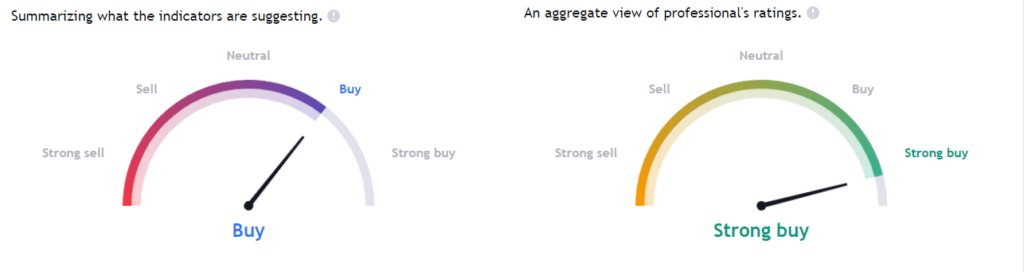
As per the Tradingview, experts are extremely bullish on AMZN stock and are expecting higher prices in the upcoming days. The provided rating is given by various experts together considering various factors like financials and technicals of the stock. The technical summary tool of Tradingview also indicates AMZN stock’s trend to be bullish on the daily timeframe.
AMZN Stock Breaks Below Swing Low, Further Decline Coming In Price?
AMZN Stock Chart By TradingView.com
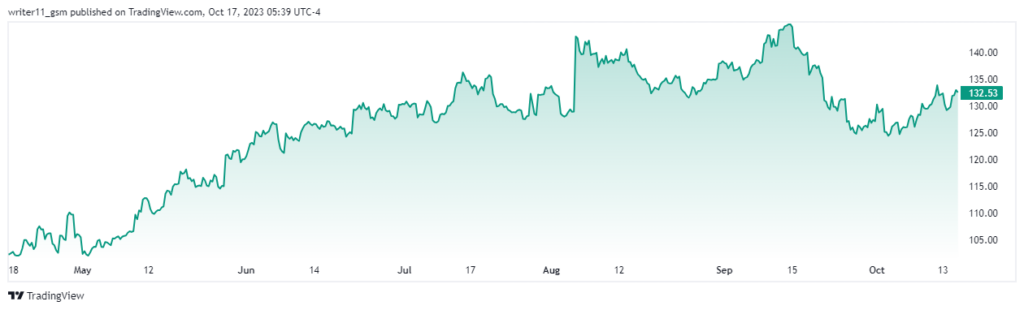
The AMZN stock price was consistently advancing to higher levels from Jan 2023 and was consistently forming higher highs. The stock price has advanced from an approximate price level of $81.00 to $145.00 in eight months and then has formed a double-top pattern on the chart.
Based on the recent price action of AMZN stock, the share price has recently broken below the last swing low and is currently retracing to the breakdown level. If the AMZN stock further breaks below the level of $129.00, it will result in the trend continuation of a bearish trend.
The AMZN stock price is currently trading at a 50-day EMA and might break down to the levels of a 200-day EMA. Although the EMAs are in a golden cross on the chart the current price behavior of the stock represents uncertainty.
The RSI is advancing representing bullish momentum on the AMZN stock chart. If it manages to sustain above the 50-level, it might lead to much higher prices in the stock.
Conclusion
Despite, the reliable fundamentals and financials of the company, the profit margin of the company has suddenly declined. The AMZN stock’s trend also looks to be weakening on the charts as it has broken below the crucial support. The indicators represent uncertainty in the price while the stock is trading at a very crucial level and may take resistance at the same spot.
Therefore, if the AMZN stock price breaks below the level of $129.00 we might witness a continuation in the downtrend of the stock and get to see lower prices in the upcoming days.
Technical Levels
- Support levels- $114.00 and $124.00
- Resistance levels- $145.00 and $158.00
Disclaimer
The information provided in this article, including the views and opinions expressed by the author or any individuals mentioned, is intended for informational purposes only. It is important to note that the article does not provide financial or investment advice. Investing or trading in cryptocurrency assets carries inherent risks and can result in financial loss.




