
 Quack AI
 Pons
Pons Lighter
 Sui
Sui NEAR Protocol
 NeoSoul
 Quant
Quant
- The NKE share price is currently trading at $99.91.
- The share price is in a short-term bull run.
Nike (NKE) Stock Analysis
The NKE stock price closed its last intraday session at $99.91 with a gain of 0.66%. The stock traded with a volume of 8.785 Million and has an average 1-day trading volume of 8.934 Million. It is a large-cap company with a market capitalization of $152.064 Billion.
Will Buying Pressure Continue in the NKE 1-Day Chart?
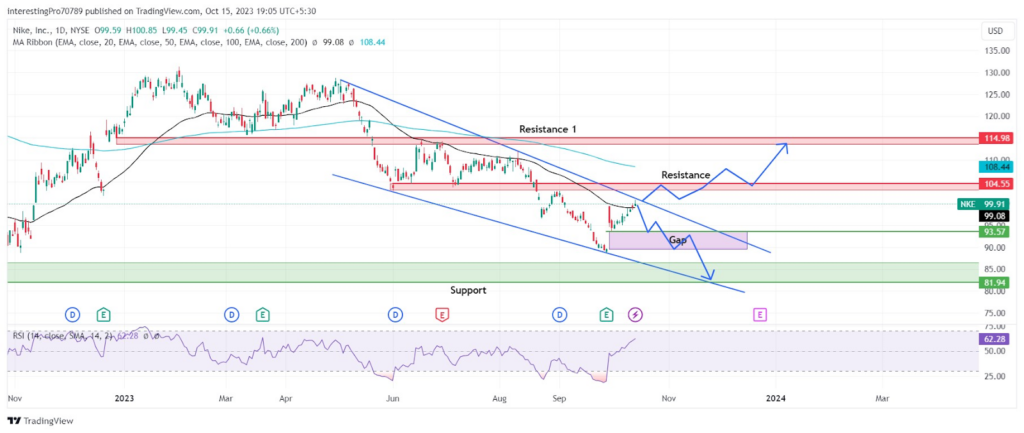
The NKE stock price has initiated a bullish rally and is currently facing rejection from the upper trendline of the descending channel. There is also a gap left in the Nike 1-day chart.
The price has recently reclaimed the 50-day EMA and is sustaining above it. However, it is facing rejection from the upper trendline of the descending channel. If it breaks above the trendline, it would add more volume in buying pressure and it could rise to test the 200-day EMA.
The relative strength index (RSI) is at 62.28, which is marked as bullish territory. The RSI line is also trending in the upward direction. This shows that the price is facing high buying pressure resulting in the RSI trending in the upward direction.
The price is initiating a short-term bullish rally and has reclaimed the 50-day EMA. However, it is facing rejection from the upper trendline of the descending channel. If the next upcoming candles give the breakout of the descending channel, then it would add more volume to the buying pressure. After this, the price could move up to retest the immediate resistance at $104.55.
However, for the price to continue its bullish run, it should close and sustain above the $104.55 resistance level. It will then continue its upward move to its next resistance at $114.98.
If the next candle closes below the current candle or forms a strong bearish candle by touching the upper trendline of the descending channel,it may then fall to its recent low support at $93.57. However, if the candle closes below the $93.57 level, then it will fill the gap and may fall to its support at $81.94.
Conclusion
The future price trend of NKE stock is not confirmed as the price has not yet given the breakout of the descending channel pattern. Currently, it is facing rejection from the upper trendline of the descending channel after a short-term bull run. The indicators are showing bullish sentiments over the price.
The price needs more buying pressure to give the breakout of the descending channel. It will reach its immediate resistance at $104.55. Consequently, traders should wait for the breakout of the $104.55 level. After this, the price may reach its next resistance at $114.98.
Technical levels
Resistance Levels: $104.55 and $114.98.
Support Levels: $93.57 and $81.84.
Disclaimer
The views and opinions stated by the author or any other person named in this article are for informational purposes only. They do not provide financial, investment, or other advice. Investing or trading in crypto comes with a risk of financial loss.




