
 NEAR Protocol
 Bitcoin
 Aerodrome Finance
 Pearl
Pearl Uniswap
 Quantus
 Pudgy Penguins
- Procter & Gamble Company stock is currently trading at $147.5 with a decline of 1.63% in today’s market session.
- Procter & Gamble Company stock has declined over -4% in the last six months.
- The technical indicators summary gives a ‘sell’ signal for PG stock.
Procter & Gamble Company (NYSE: PG) is involved in offering a range of consumer packaged goods under its various brand names. Its operational structure comprises distinct segments, including Beauty, Grooming, Health Care, Fabric and Home Care, and Baby, Feminine, and Family Care.
PG stock is currently in a downtrend, characterized by lower price points and retracements from resistance levels.
At present, the market price of PG stock stands at $147.5, showing a 1.6% decrease in the current market session. The company has a share float of 2.3 billion shares and an average trading volume of 6.5 million.
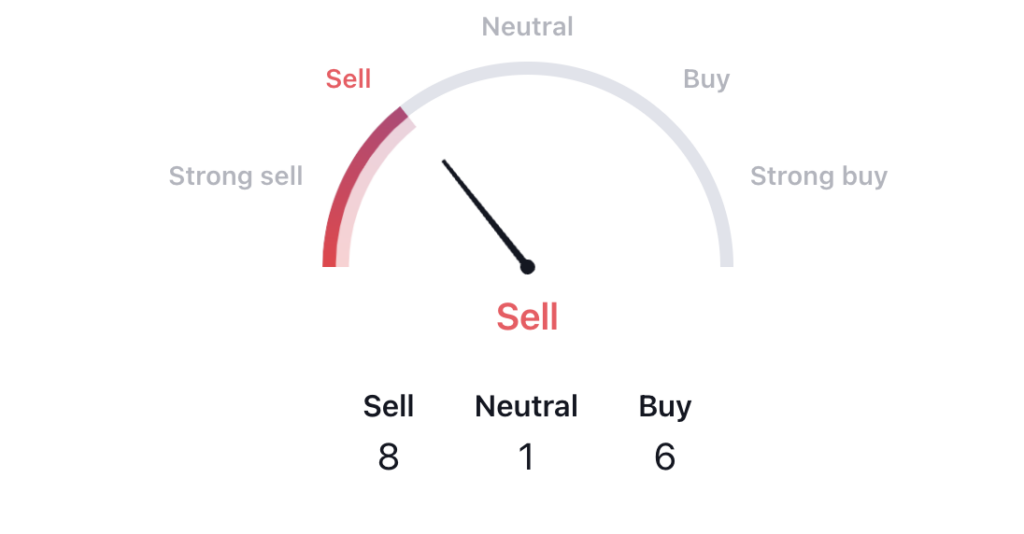
The technical summary widget indicates a ‘sell’ signal for PG stock, with 14 out of 26 indicators giving a ‘sell’ signal in the shorter time frames, suggesting a potential price decline in the coming days.
Procter & Gamble Company (PG) stock reached an all-time high of $164.9 but subsequently began a descent, resulting in a nearly 24% decline by the end of 2022. However, the price found support at the $123 level, leading to a temporary rebound.
Following a reversal from the resistance level, PG stock has seen a price decline. Currently, the stock is moving in a downtrend, exhibiting a weak structure, and its price is likely to continue declining in the near future.
Procter and Gamble Company (PG) Stock Price Analysis
PG by writer50_tcr on TradingView.com
The MACD line residing below the signal line is generally regarded as a negative indicator, and the presence of a red histogram reinforces this view. These factors collectively suggest an unfavorable outlook for the stock price, hinting at a potential decline in the future.
Furthermore, the RSI line is currently positioned below the SMA line, and both lines are hovering near the 40 level. This is a negative territory, indicative of an overall bearish trend.
Conclusion
As per the analysis, PG stock is currently moving in a downtrend. The price has formed a negative pattern and the price has given a negative return in the previous six months. Moreover, the indicators are signaling a bearish outlook, and the stock has experienced a breakout from a triangular pattern. Considering these elements collectively, it can be inferred that there is a substantial likelihood of the price decreasing.
Technical Levels
- Support Level– $142
- Resistance Level- $158
Disclaimer
The views and opinions of the author or anyone name in this article are for informational purposes only. They do not offer financial, investment, or other advice. Investing or trading crypto assets involves the risk of financial loss.



